Figure 2.
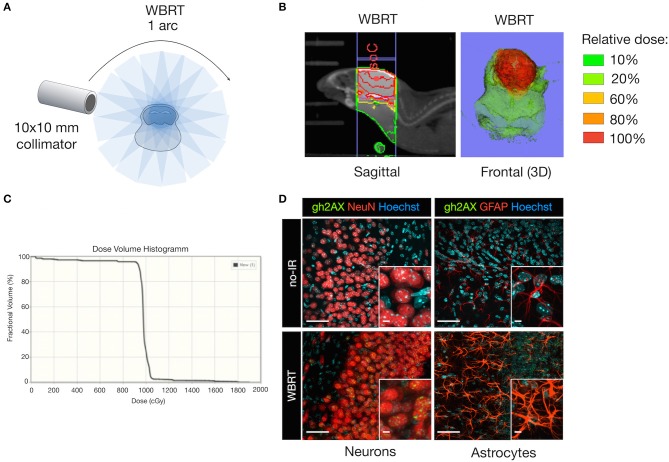
DNA damage in brain-resident cell types in response to irradiation. (A) Schematic depicting the treatment planning of whole brain radiotherapy (WBRT) using the 10 × 10 mm collimator. Radiation was applied as a single dose of 10 Gy using 1 arc. (B) Representative image of the dose distribution in the target region. The isocenter (IsoC) is depicted by the red dot. Color shades visualize the distribution of the relative dose. Shown is a sagittal view (left panel) and a three-dimensional (3D) reconstruction of the frontal view. (C) Dose volume histogram indicating the percentage of fractional volume over the radiation dose in cGy. (D) Representative images of γH2AX expression (green, lower panel) in NeuN+ neurons (red; left lower panel), GFAP+ astrocytes (red; right lower panel) on cleared thick brain sections 6 h after WBRT. Controls without WBRT are shown in the upper panel. Hoechst was used as nuclear counterstain. Scale bars indicate 50 and 5 μm.

