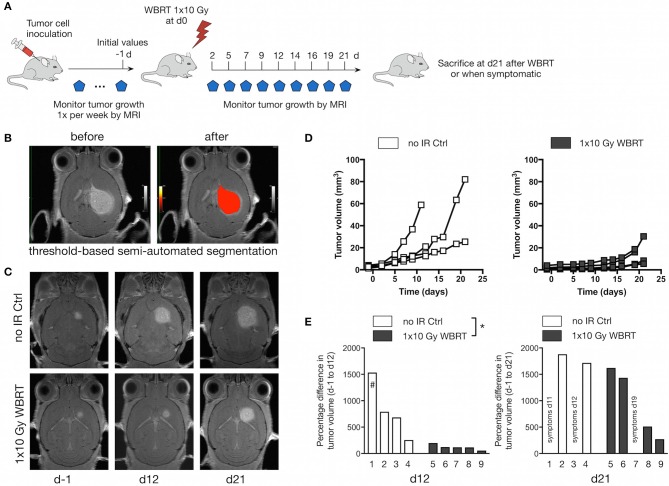
Figure 3.
Therapeutic response to WBRT in BrM. (A) Schematic depicting the experimental design to follow tumor progression after WBRT in BrM. (B) Representative MR images showing detection and volumetric assessment of metastatic lesions using the threshold-based semi-automated segmentation tool (Chimaera GmbH). (C) Representative MR images of tumor-bearing mice with and without WBRT at different time points. (D) Quantification of the increase in tumor volume over time in tumor-bearing no-IR control mice (n = 4) and in response to 1 × 10 Gy WBRT (n = 5) using MRI. Curves depict tumor growth of individual mice. (E) Waterfall plots depict the percent increase in tumor volume on d12 and d21 relative to d-1. #Data shown for Mouse 1 were acquired on d11. P-values were obtained using two-way ANOVA and unpaired two-sided Student's t-test. *P < 0.05.

