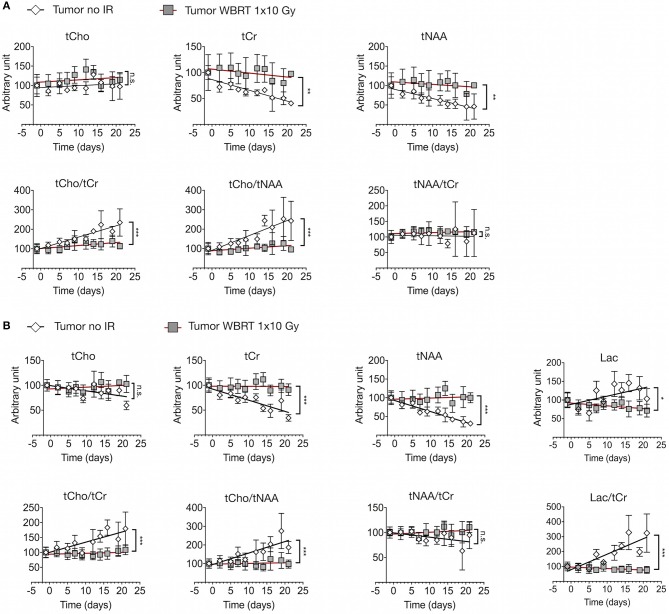
Figure 5.
Metabolic changes in response to tumor progression and radiotherapy (A) Signal intensity of tCho, tCr, and tNAA (upper panel) and ratio of tCho/tCr, tCho/tNAA, and tNAA/tCr (lower panel) in tumor-bearing untreated mice (n = 4) and tumor-bearing mice with WBRT (n = 3) at short echo time (16.5 ms) (depicted as arbitrary units). (B) Signal intensity of tCho, tCr, tNAA and Lac (upper panel) and ratio of tCho/tCr, tCho/tNAA, tNAA/tCr, and Lac/tCr (lower panel) in tumor-bearing untreated mice (n = 3) and tumor-bearing mice with WBRT (n = 3) at long echo time (135 ms) (depicted as arbitrary units). P-values were calculated based on linear regression analysis and comparison between the slopes. n.s. = not significant, *P < 0.05, **P < 0.01, ***P < 0.001.

