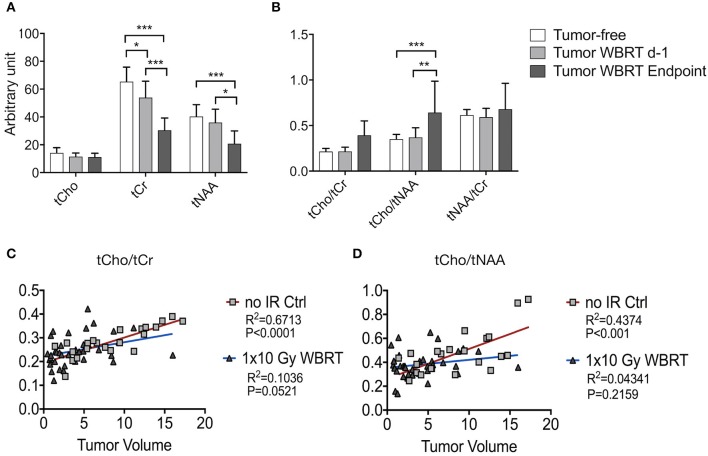
Figure 6.
MRS data and its correlation with volumetric measurements by MRI (A,B) Signal intensity of tCho, tCr, tNAA (A) and ratio of tCho/tCr, tCho/tNAA, and tNAA/tCr (B) in wild-type mice and tumor-bearing mice at d-1 before WBRT and in end-stage tumors (depicted as arbitrary units). (C,D) Correlation between tumor volume and metabolite levels for untreated tumor bearing animals and after WBRT. Shown are graphs for tCho/tCr (C), tCho/tNAA (D) and tumor size ranging from 0.5 to 20 mm3. Data are presented as mean ± s.d. P-values were obtained using two-way ANOVA and unpaired two-sided Student's t-test. Correlation between tumor volume and metabolic parameter was determined by linear regression coefficient and goodness of fit is presented as R2. n.s. = not significant, *P < 0.05, **P < 0.01, ***P < 0.001.

