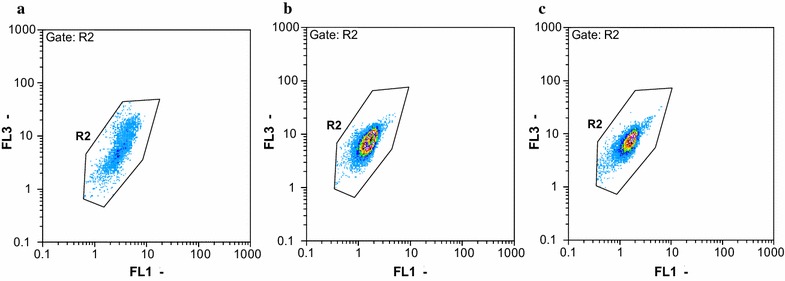
Fig. 2.

Examples of flow cytometric dot plots of strain WZN-1 at different time during BDE 209 degradation: a 0 day; b 15 days; c 30 days. FL1 represents green fluorescence was collected at FL1 = 520 ± 20 nm, and FL3 represents the red fluorescence was collected at FL3 = 630 nm
