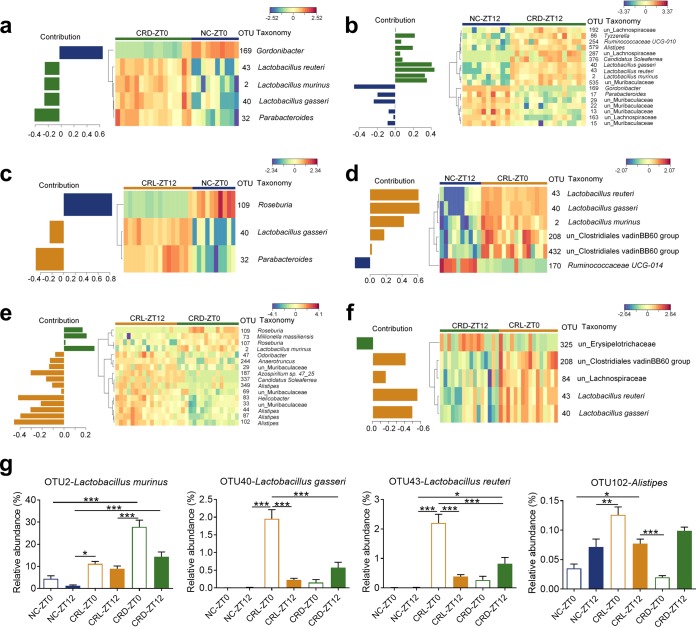
FIG 5.
Shifting feeding time impacts fecal microbiota composition. (a to f) Contribution plots and heatmaps of key OTUs for separating the gut microbiota among different groups after 4-week CR are shown in NC-ZT0 and CRD-ZT0 (a), NC-ZT12 and CRD-ZT12 (b), NC-ZT0 and CRL-ZT12 (c), NC-ZT12 and CRL-ZT0 (d), CRL-ZT12 and CRD-ZT0 (e), and CRL-ZT0 and CRD-ZT12 (f). The color of the spots represented the relative abundance (normalized and log transformed) of the OTUs in each group. OTUs were arranged according to clusters based on the complete linkage method. The taxonomy of each OTU is shown on the right. See Fig. S7 for sPLS-DA models. (g) Relative abundances of three Lactobacillus OTUs and one Alistipes OTU after 4-week CR. For NC group, n = 10; for CRL and CRD groups, n = 8. Data are presented as the mean ± SEM and analyzed using two-way repeated-measures ANOVA, followed by a Tukey post hoc test. ***, P < 0.001; **, P < 0.01; *, P < 0.05.

