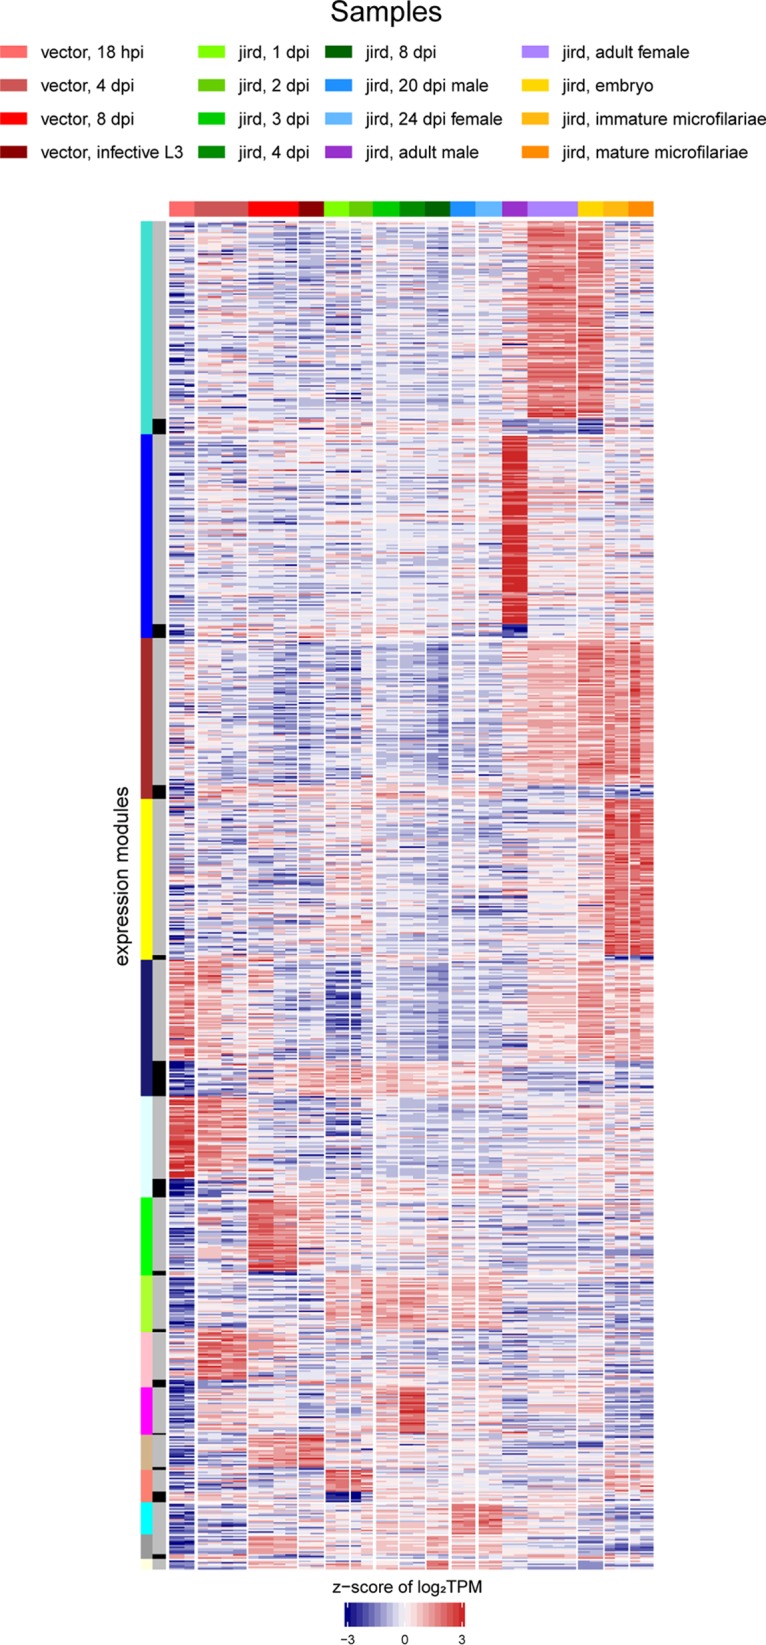
FIG 3.

B. malayi WGCNA expression modules. The heatmap shows the z-score of the log2(TPM) values of the 10,297 differentially expressed B. malayi genes across the B. malayi life cycle. The horizontal color bar and the key above the heatmap indicate the samples represented in each of the heatmap columns. The leftmost vertical color bar on the left of the heatmap represents the 15 different WGCNA expression modules generated using the 10,297 differentially expressed B. malayi genes. Within each individual expression module, there are two expression patterns that are the opposite of each other. The inner vertical colored bar indicates whether the gene clusters with the main (gray) or inverse (black) expression pattern of the module.
