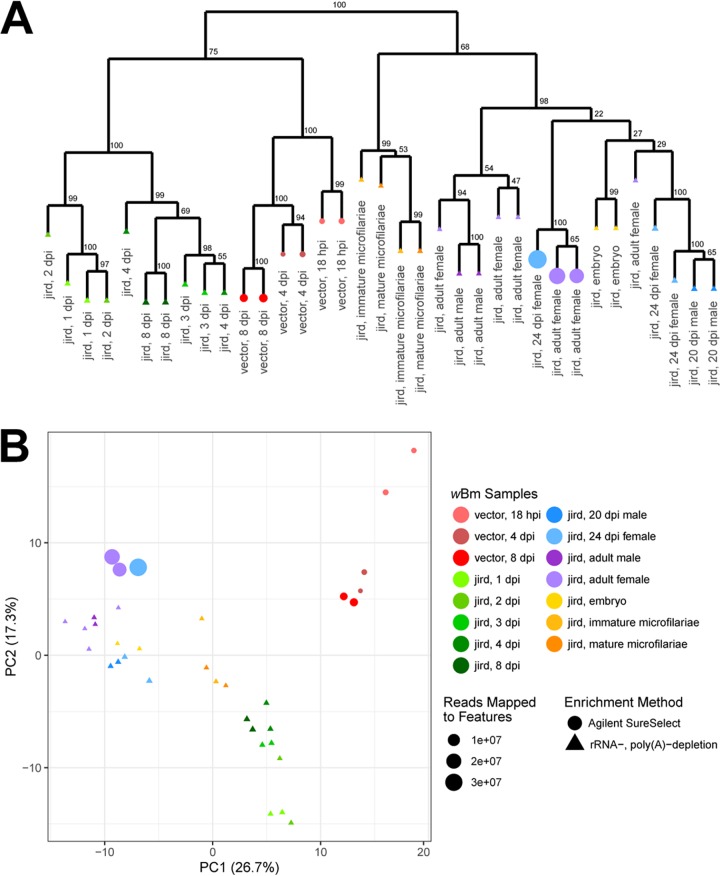
FIG 4.
Hierarchical clustering and PCA of the differentially expressed wBm genes. (A) For each sample, the z-scores of the log2(TPM) values of the 318 differentially expressed wBm genes were used to hierarchically cluster the wBm samples using 100 bootstraps with support values indicated at each node. Samples represented by triangles were prepared using an rRNA and poly(A) depletion, while samples represented by circles were prepared using a wBm-specific AgSS capture performed on total RNA. (B) A PCA was performed using the z-score of the log2(TPM) values of the 318 differentially expressed wBm genes. The first and second principal components are plotted on the x and y axes, respectively. The variation represented by each of the principal components is indicated in parentheses next to the axis titles. Points are sized relative to the number of reads mapping to genes for each sample.

