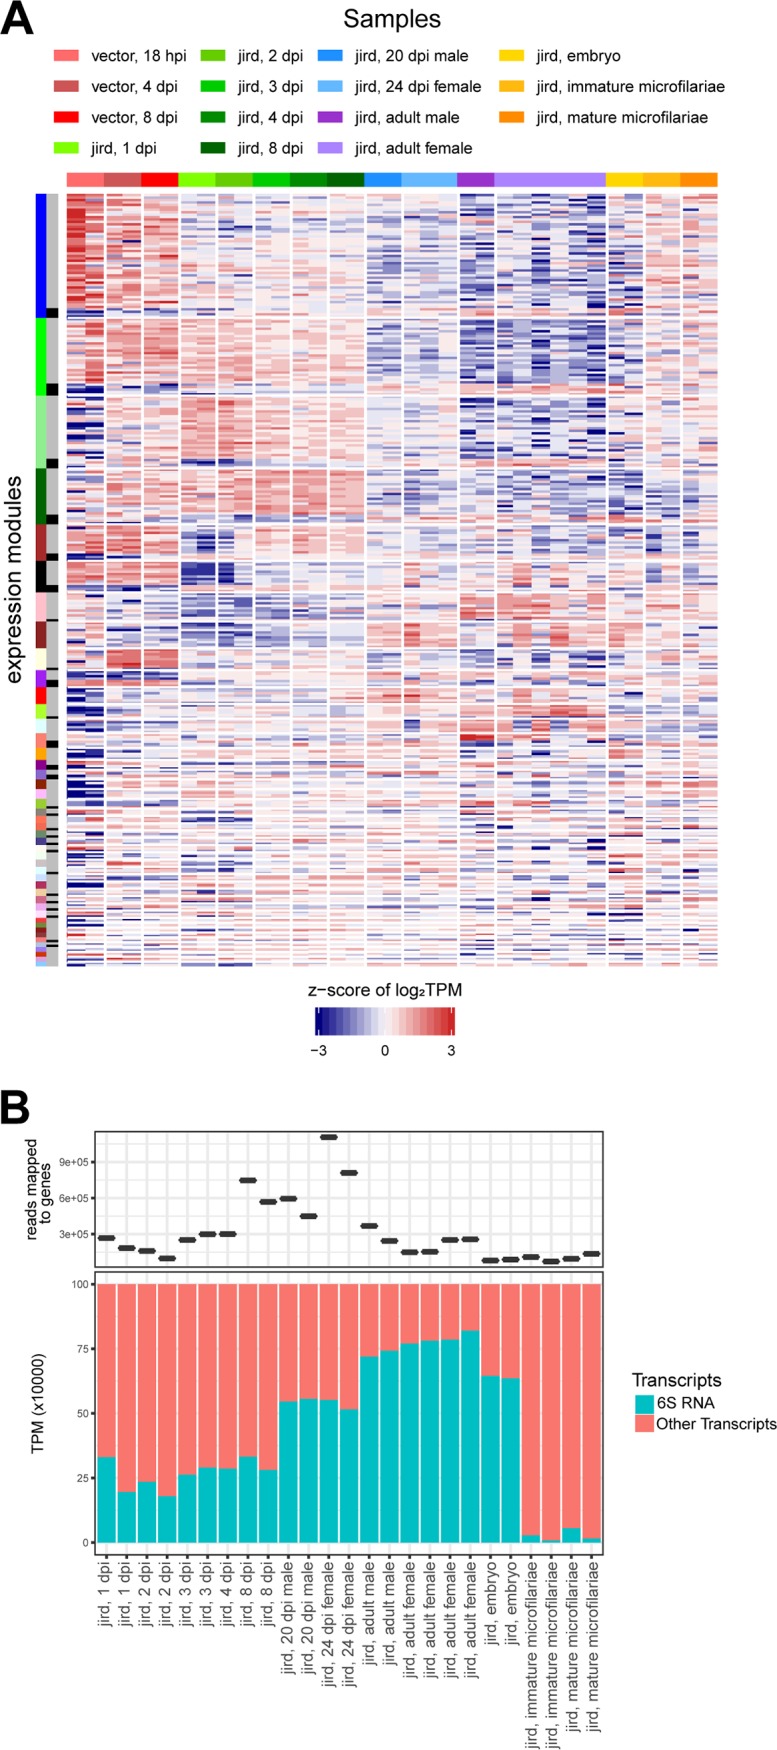
FIG 5.

wBm WGCNA expression modules and 6S RNA expression. (A) The heatmap shows the z-score of the log2(TPM) values of the 318 differentially expressed wBm genes across the B. malayi life cycle. The horizontal color bar and the key above the heatmap indicate the samples represented in each of the heatmap columns. The leftmost vertical color bar on the left of the heatmap represents the six different WGCNA expression modules generated using the differentially expressed wBm genes. The inner vertical colored bar indicates whether the genes cluster with the main (gray) or inverse (black) expression pattern of the module. (B) The upper plot indicates the number of reads mapped to genes in each of the samples. The bottom plot indicates the TPM value of the 6S RNA compared with that of all other transcripts for all poly(A)-selected samples. The Agilent SureSelect samples are excluded from the plot because there were no probes designed to capture the non-protein-encoding RNAs, such as the 6S RNA. Additionally, one replicate of 4 dpi underwent column purification, leading to the loss of small RNAs, and is not shown.
