FIG 6.
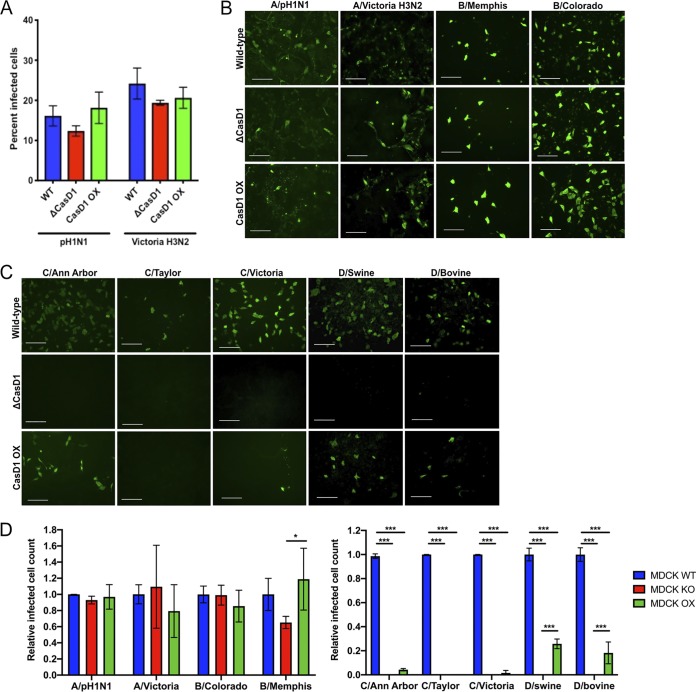
Infection of WT, ΔCasD1, and CasD1-OX cells with IAV, IBV, ICV, and IDV. (A) HEK-293 WT, ΔCasD1, CasD1-OX cells were inoculated at an MOI of 0.1 with IAV strains pH1N1 (A/California/04/2009) and Victoria H3N2 (A/Victoria/361/2011). The cells were fixed at 24 h, and the infected cells per field were counted. Each experiment was performed in triplicate. Data analyzed by two-way ANOVA using Prism software. (B) MDCK WT, ΔCasD1, and CasD1-OX cells were inoculated at a high MOI with IAV strains pH1N1 (A/California/04/2009) and Victoria H3N2 (A/Victoria/361/2011, and IBV strains B/Memphis/1/2018 and B/Colorado/06/2017 for 48 h and then imaged at ×10 magnification. Scale bar, 100 μm. Representative images of three independent experiments are shown. (C) MDCK WT, ΔCasD1, and CasD1-OX cells were inoculated at a high MOI with ICV strains C/Ann Arbor/1/50, C/Taylor/1233/1947, and C/Victoria/1/2011 and IDV strains D/bovine/MS/C000020N/2014 and D/swine/OK/1334/2011 for 48 h and then imaged at ×10 magnification. Scale bar, 100 μm. Representative images of three independent experiments are shown. (D) Quantification of the relative infected cell counts for panels B and C, as determined through image analysis with ImageJ. Data were analyzed by two-way ANOVA using Prism software. *, P ≤ 0.05; **, P ≤ 0.01; ***, P ≤ 0.001.

