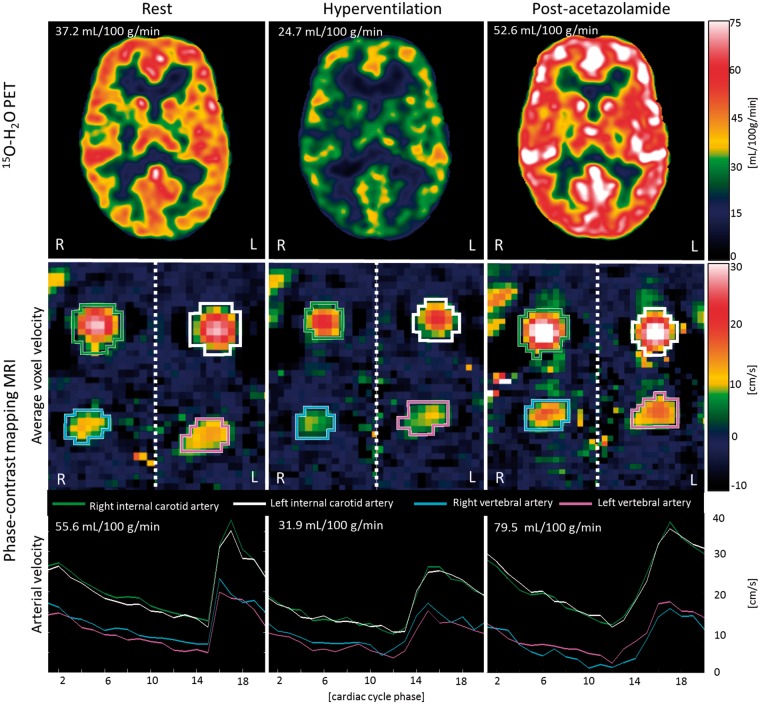
Figure 2.
Examples CBF measurements. Panels show 15O-H2O PET CBF images (top row), PCM MRI average velocity images across the cardiac cycle (middle row) and arterial mean velocity of each vessel over the cardiac cycle (bottom row) in each state from a single volunteer. Colored ROI for each vessel are displayed over the average velocity images and the corresponding arterial flow over the cardiac cycle is shown below. L: left; R: right.

