Figure 1.

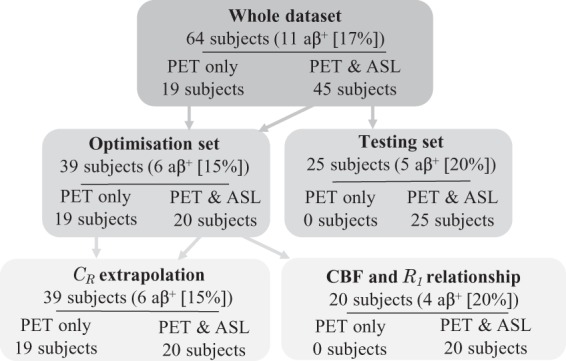
Flow chart describing data division between optimisation and testing sets, with the number of subjects defined as amyloid positive () using SUVR with a whole cerebellum reference region.

Flow chart describing data division between optimisation and testing sets, with the number of subjects defined as amyloid positive () using SUVR with a whole cerebellum reference region.