Figure 1.

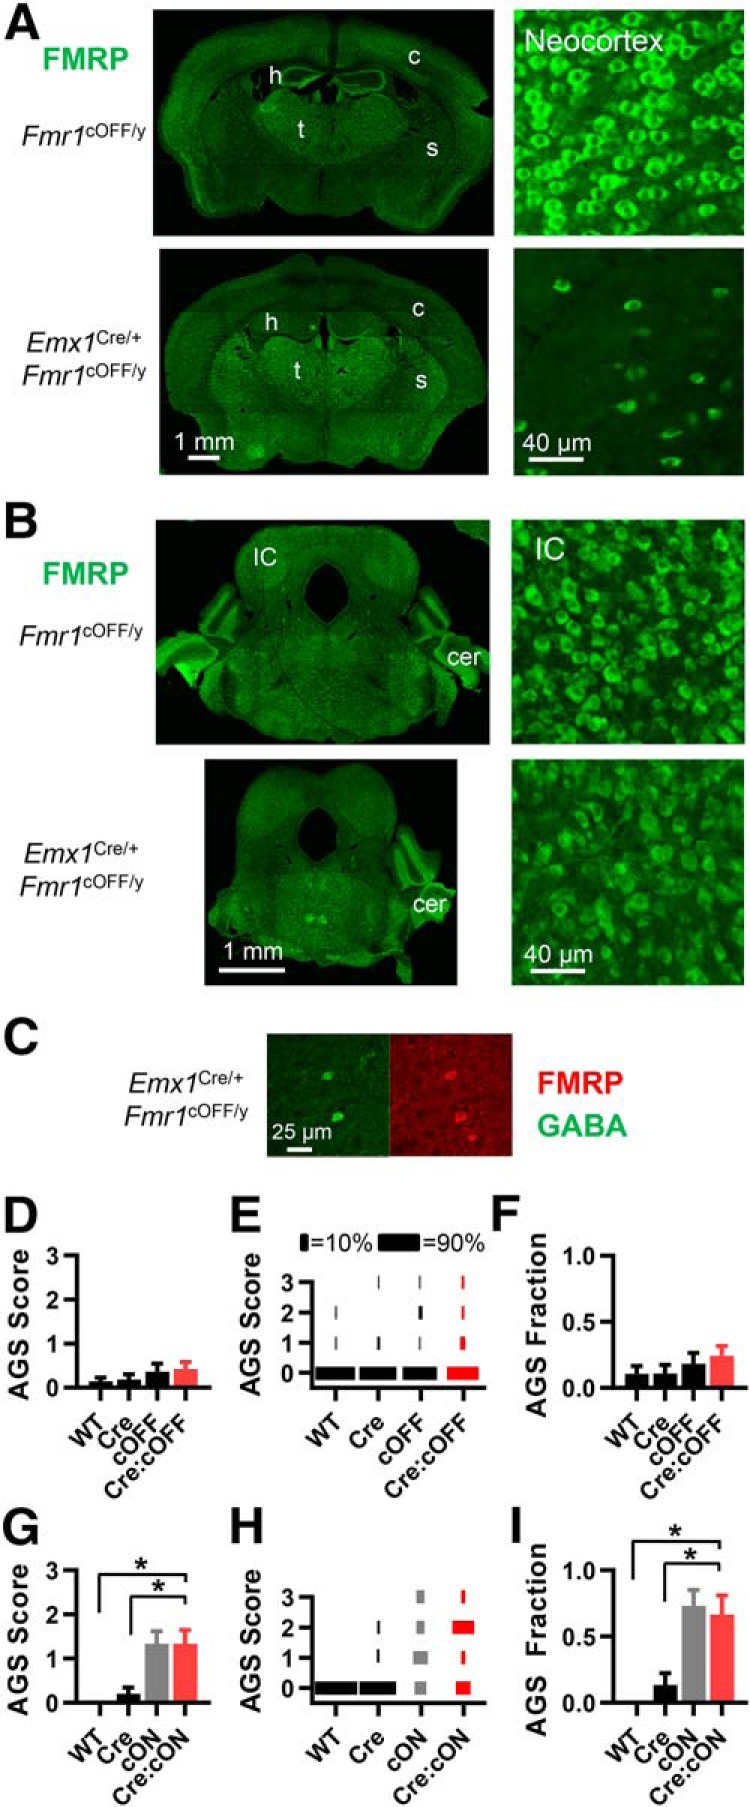
Fmr1 deletion in Emx1-expressing cells, primarily cortical excitatory neurons and cortical glia, is neither sufficient nor necessary for recapitulating the AGS phenotype. A, FMRP immunohistochemistry in forebrain in brain sections obtained from Fmr1cOFF/y and Emx1Cre/+:Fmr1cOFF/y mice. FMRP expression is dramatically reduced in neocortex (c) and hippocampus (h), but not striatum (s) or thalamus (t). B, FMRP expression is unchanged in the midbrain as seen in the inferior colliculus (IC) and cerebellum (cer). Scale bars at bottom apply to the whole column. C, High-power images of cortex showing immunohistochemistry for GABA (green) and FMRP (red) illustrating the selective deletion of Fmr1 in neocortical cells that are not GABAergic. D–F, AGS data for mice derived from Emx1Cre/+ and Fmr1cOFF/y cross-breeding. Deletion in cortex (red bar) does not result in a change in AGS measurements compared with WT controls (black bars). Therefore, deletion was not sufficient for the AGS phenotype. D, AGS scores for the four different possible genotypic combinations. E, Distribution of AGS scores by percentage. F, AGS fraction (the fraction of all mice that had nonzero AGS scores). G–I, Same analysis applied for mice derived from Emx1Cre/+ and Fmr1cON/y cross-breeding. AGS measurements resulting from Fmr1 expression in cortex are no different from cON-KO controls (gray) and increased compared with WT controls (black). Therefore, deletion was not necessary for the AGS phenotype. For all figures, black indicates WT controls, gray indicates the cON-KO control, and red indicates the gene expression manipulation group. N values for AGS data were as follows: cOFF = 28, 27, 22, 33 mice; and cON = 9, 15, 15, and 12 mice. *p < 0.05, K-W ANOVA followed by Dunn's test.
