
Figure 2.
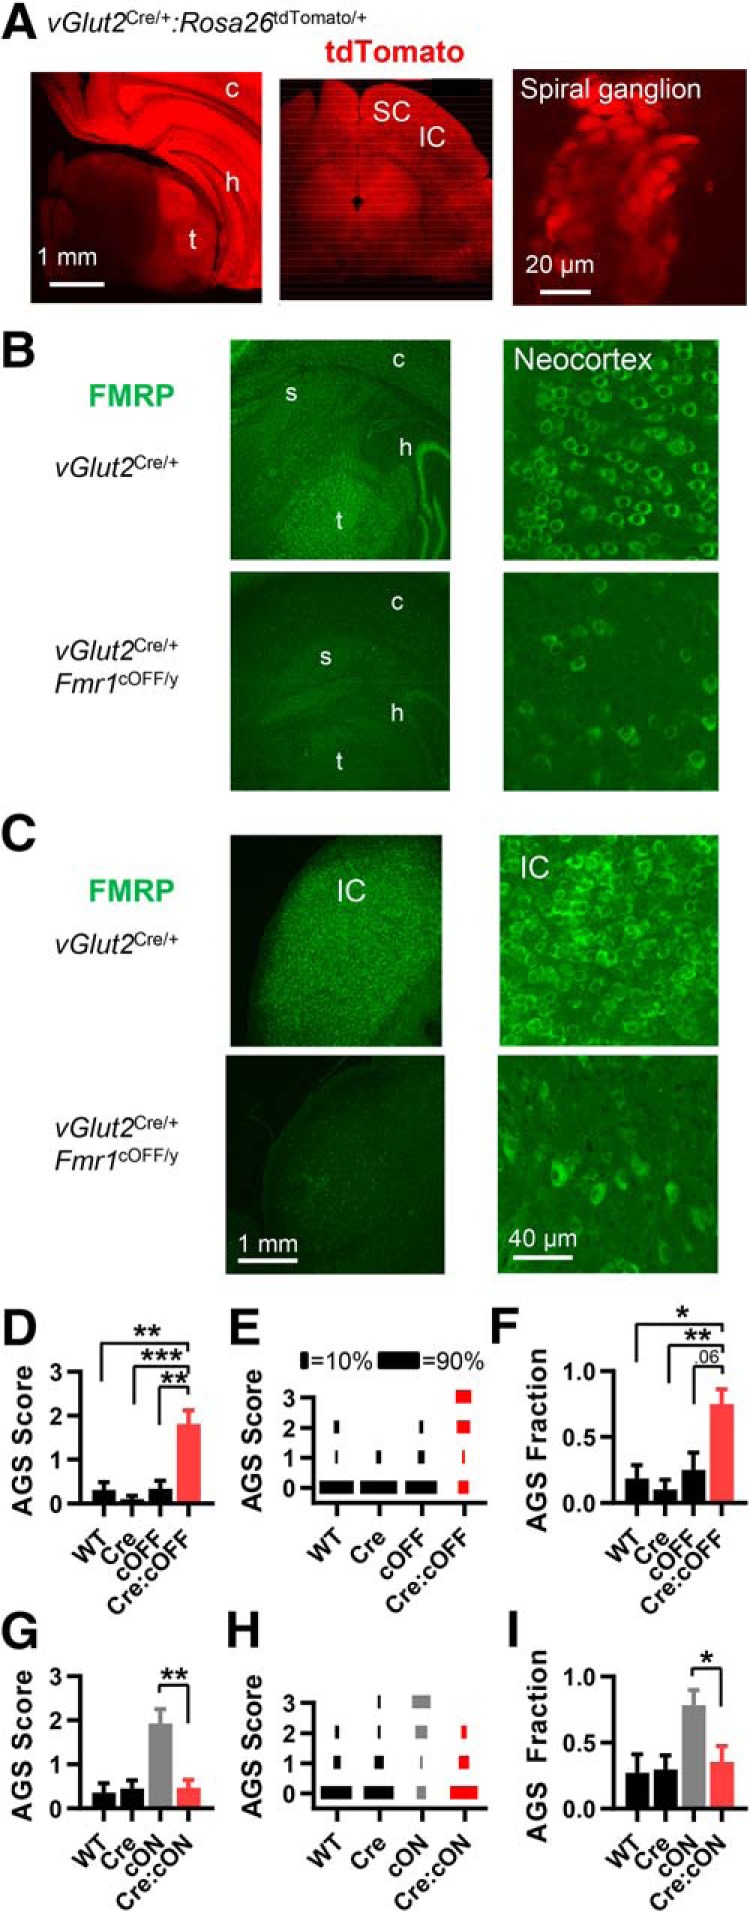
Fmr1 deletion in VGlut2-expressing glutamatergic neurons is sufficient and necessary for recapitulating the AGS phenotype. A, tdTomato fluorescence in live coronal slices obtained from vGlut2Cre/+:Rosa26tdTomato/+ mice. Left, middle, Fluorescence indicates abundant Cre expression in cortical, thalamic, and midbrain regions. Right, With the organ of Corti preparation, fluorescence indicates Cre expression in spiral ganglion neurons. Other abbreviations are stated in Figure 1. B, C, FMRP immunohistochemistry in forebrain (B) and in the inferior colliculus (C) obtained from vGlut2Cre/+ and vGlut2Cre/+:Fmr1cOFF/y mice. Consistent with the tdTomato reporter expression in A, FMRP expression is dramatically reduced in both of these regions. D–F, AGS data for mice derived from vGlut2Cre/+ and Fmr1cOFF/y cross-breeding. Deletion in vGlut2-expressing neurons (in red) results in increased AGS measurements compared with WT controls (black). Therefore, deletion was sufficient for the AGS phenotype. G–I, AGS data for mice derived from vGlut2Cre/+ and Fmr1cON/y cross-breeding. AGS measurements resulting from Fmr1 expression in VGlut2-expressing neurons are no different from WT controls (black) and are reduced compared with the cON-KO control (gray). Therefore, deletion was necessary for the AGS phenotype. N values for AGS data were as follows: cOFF = 16, 19, 12, and 16; cON = 11, 20, 14, and 17. *p < 0.05, **p < 0.01, ***p < 0.001. K-W ANOVA followed by Dunn's test.