
Figure 5.
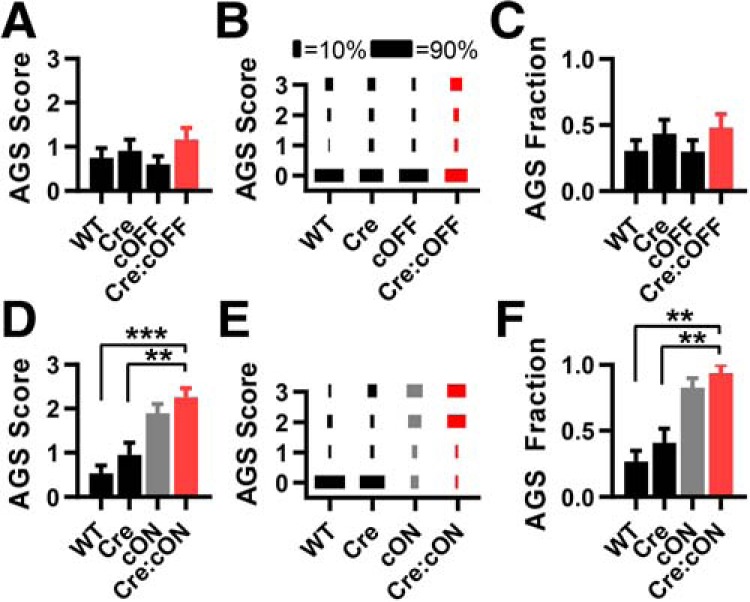
Fmr1 deletion in Egr2-expressing cells in the brainstem and neocortex is neither sufficient nor necessary for recapitulating the AGS phenotype. A–C, AGS data for mice derived from Egr2Cre/+ and Fmr1cOFF/y cross-breeding. Deletion in cortex does not result in a change in AGS measurements compared with WT controls. D–F, Data derived from Egr2Cre/+ and Fmr1cON/y cross-breeding. AGS measurements resulting from expression resulting from Cre-dependent Fmr1 expression are no different from the cON-KO control and increased compared with WT controls. N values for AGS data were as follows: cOFF = 33, 23, 30, and 25; cON = 30, 22, 29, and 16. **p < 0.01, ***p < 0.001. K-W ANOVA followed by Dunn's test.