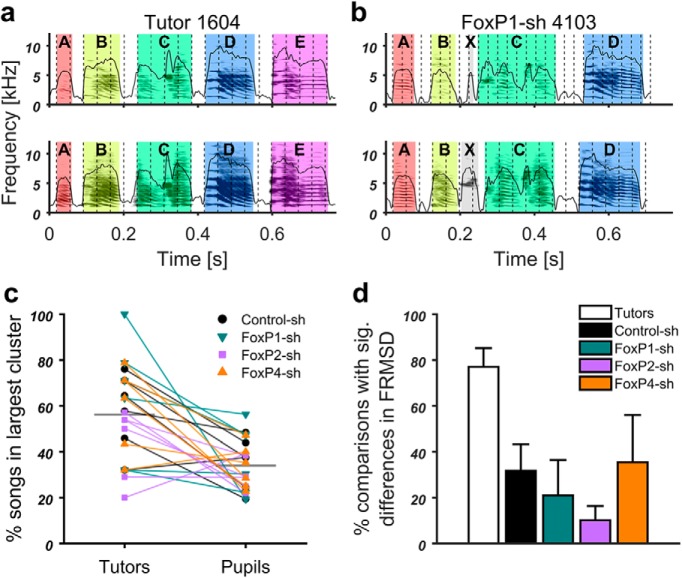
Figure 13.
All pupil groups had lower song isochronicity than tutors. a, b, Two example motifs each of FoxP1-sh bird 4103 (b) and its Tutor bird 1604 (a) with the isochronous pulse best fitting to song element onsets overlaid as vertical dashed lines. a, Tutor bird 1604 had almost the same pulse frequency for both renditions (top: 27.49 Hz; bottom: 27.64 Hz). Pulse fit as measured by FRMSD from element onsets (see Materials and Methods) was relatively high (top: FRMSD = 0.019; bottom: FRMSD = 0.024). b, FoxP1-sh bird 4103 had pulses of different frequencies best fitting the two motifs (top: 39.91 Hz; bottom: 27.92 Hz) and a relatively low pulse fit (top: FRMSD = 0.086; bottom: FRMSD = 0.086). c, Paired plot of the percentage of all songs that were in the largest pulse frequency cluster for each bird. Lines connect each pupil (right) with his tutor (left). Black horizontal lines indicate the mean. Except for 3 birds (1 Control-sh, 1 FoxP2-sh, 1 FoxP4-sh), all pupils had a lower percentage compared with their tutor. d, Bar graph of the percentage of bird-to-model comparisons with significant differences (p < 0.05) in pulse deviation (FRMSD), in which the bird had a lower deviation (±SEM) than the model (i.e., a better rhythm).

