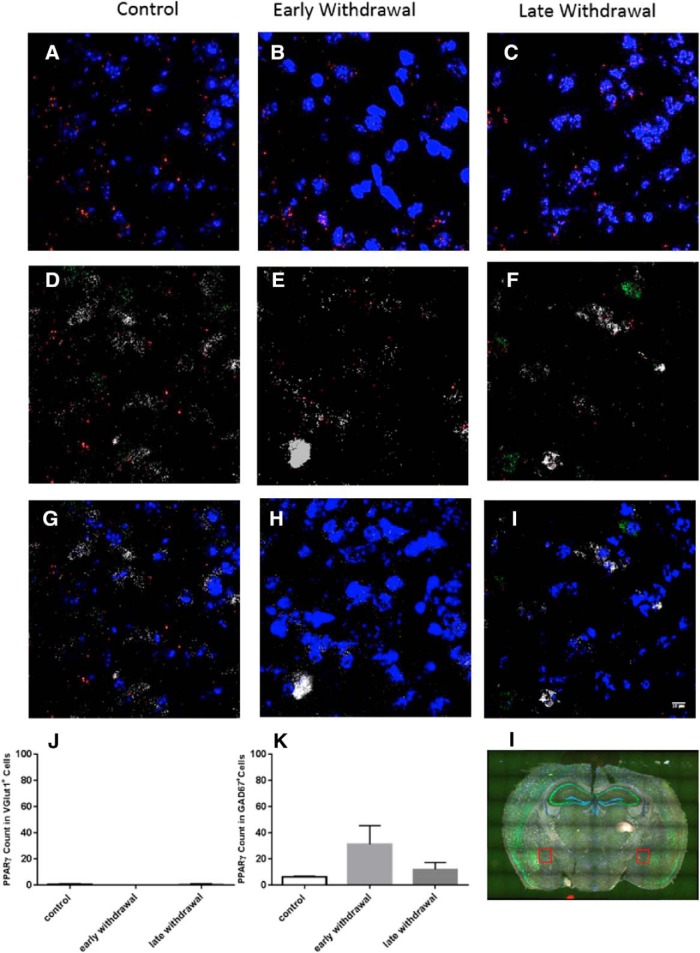
Figure 5.
PPARγ transcription levels in CeA. Representative images (40× magnification) in CeA for PPARγ (red) + GAD67 (white) and DAPI (blue) in control, early, and late nicotine withdrawal. A–C, Merge of PPARγ (red) + DAPI (blue) counts. (D–F) represents PPARγ+ GAD67 + cells and (G–I) represents the merge of PPARγ +, GAD67+, and DAPI cells. J, PPARγ counts in VGLUT1+ cells, (K) PPARγ counts in GAD67+ cells, and (L) coronal brain section illustrating CeA region sampled for RNAscope ISH analysis. Data are expressed as mean ± SEM values.

