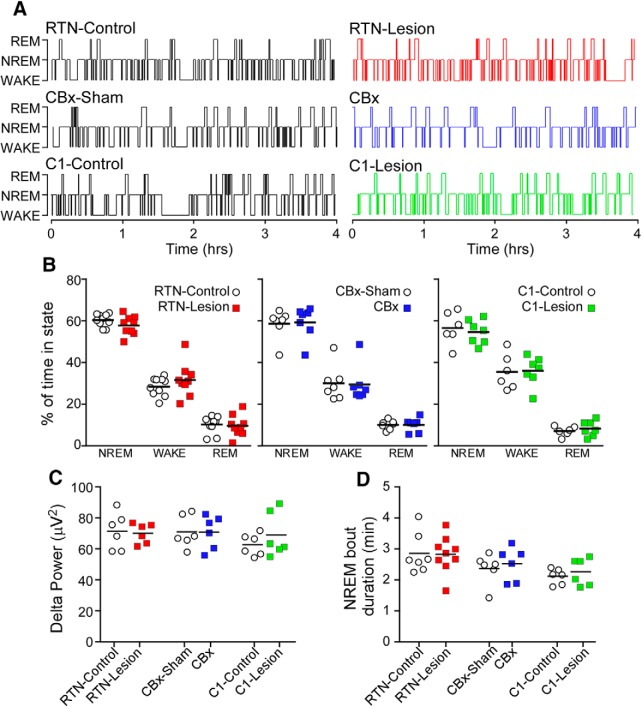
Figure 6.
Sleep–wake behavior is unaffected by ablation of the RTN, CBs, or C1 neurons. A, Hypnograms from RTN-Control, RTN-Lesion, CBx-Sham, CBx, C1-Control, and C1-Lesion rats. Recording time starting at 0900–1000 h and ending at 1500–1600 h. B, Percentage of time spent in NREM sleep, waking, and REM sleep in a 6 h period of testing during the light phase in all groups of rats. Repeated-measures two-way ANOVA; interaction between RTN-Lesion and sleep stage, F(2,34) = 1.1, p = 0.36; sleep stage effect, F(2,34) = 308.3, p < 0.0001; RTN-Lesion effect, F(1,17) = 4.9, p = 0.99. Repeated-measures two-way ANOVA; interaction between CBx and sleep stage, F(2,24) = 0.02, p = 0.98, sleep stage effect, F(1,14) = 125.6, p < 0.0001; CBx effect, F(1,12) = 0.18, p = 0.68. Interaction between C1-lesion and sleep stage, F(2,22) = 0.2, p = 0.86, sleep stage effect, F(1,14) = 130.4, p < 0.0001, C1-lesion effect, F(1,11) = 0.2, p = 0.68. C, Delta power during NREM sleep in all groups of rats (RTN-Control vs RTN-Lesion, t(10) = 0.2, p = 0.81; CBx-Sham vs CBx, t(10) = 0.002, p = 1.0; C1-Control vs C1-Lesion, t(10) = 1.0, p = 0.36). D, Average duration of NREM bouts in all groups of rats (unpaired t tests, RTN-Control vs RTN-Lesion, t(14) = 0.07, p = 0.94; CBx-Sham vs CBx, t(10) = 0.49, p = 0.63; C1-Control vs C1-Lesion, t(10) = 0.71, p = 0.49).

