
Figure 7.
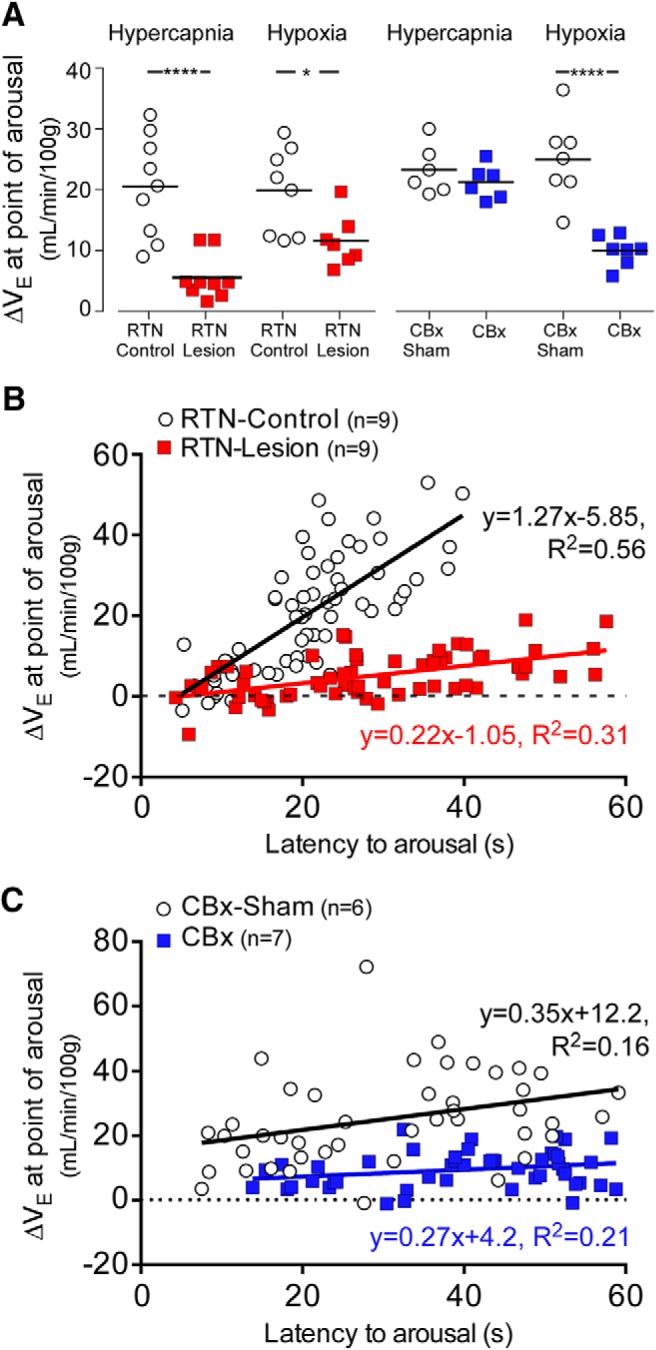
Ventilatory stimulation at the point of arousal in rats exposed to hypercapnia or hypoxia: effects of RTN lesion or CBx. A, Average ΔVE at the point of arousal for RTN-Lesion, RTN-Control, CBx, and CBx-sham rats during CO2 and hypoxia trials used to test arousal. *p < 0.05; ****p < 0.001; unpaired t test. B, Plots of ΔVE at the point of arousal versus latency to arousal during CO2 trials in RTN-Lesion and RTN-Control rats: RTN-Control vs RTN-Lesion; N = 9, 63 data points for both; Pearson r = 0.75, p < 0.0001 versus Pearson r = 0.56, p < 0.0001; linear fit slope (95% CI), 1.27 (0.99–1.56) versus 0.21 (0.13–0.30), F(1,122) = 65.0, p < 0.0001. C, plots of ΔVE at the point of arousal versus latency to arousal during hypoxia trials in CBx and CBx-Sham rats: CBx versus CBx-Sham; N = 7, 49 data points for both; Pearson r = 0.40, p = 0.0045 versus Pearson r = 0.46, p = 0.0009; linear fit slope (95% CI), 0.36 (0.12–0.59) versus 0.27 (0.12–0.42), F(1,94) = 0.55, p = 0.55, Y intercept (95% CI), 12.17 (4.2–19.73) versus 4.22 (−0.34–8.78), F(1,95) = 25.5, p < 0.0001.