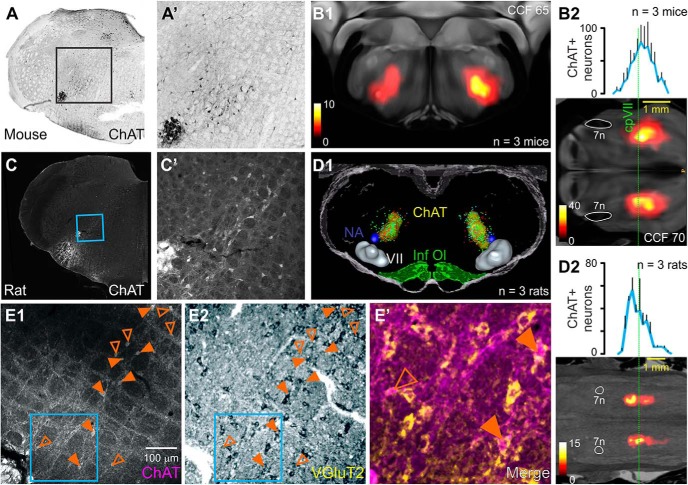
Figure 1.
Distribution of ChAT-immunoreactive neurons in the IRt of the mouse and rat. A, High magnification of boxed region in A′: lightly immunoreactive neurons dorsomedial to nucleus ambiguus in the ChAT-cre mouse. B1, Heatmap represents the epicenter of the ChAT+ population in a 100-μm-thick virtual coronal section superimposed onto the corresponding plate of the Allen Brain Atlas (level 65 of the Common Coordinate Framework [CCF]). Average rostrocaudal distribution of ChAT+ IRt neurons in the mouse is shown in the heatmap in B2 and graphed to the same scale at top. Dotted green line indicates the level of the caudal facial nucleus (cpVII). C, ChAT immunofluorescence in the rat IRt (C′, inset). D1, Individual data from 3 rats (colored dots), with density maps (yellow regions) that enclose 66% of neurons projected into volumetric atlas. D2, The rostrocaudal distribution of ChAT+ IRt neurons in 3 rats using the same scheme described in B2. E, Confocal/brightfield images illustrate colocalization of ChAT (E1) with VGluT2 mRNA (E2) in the rat IRt. Closed triangles represent doubled-labeled ChAT+ neurons. E′, Pseudocolored merged image of region indicated by blue box in E1, E2. Anatomical landmarks are nucleus ambiguus (NA), the facial nucleus (VII), inferior olive (Inf. Ol.), and facial nerve (7n).

