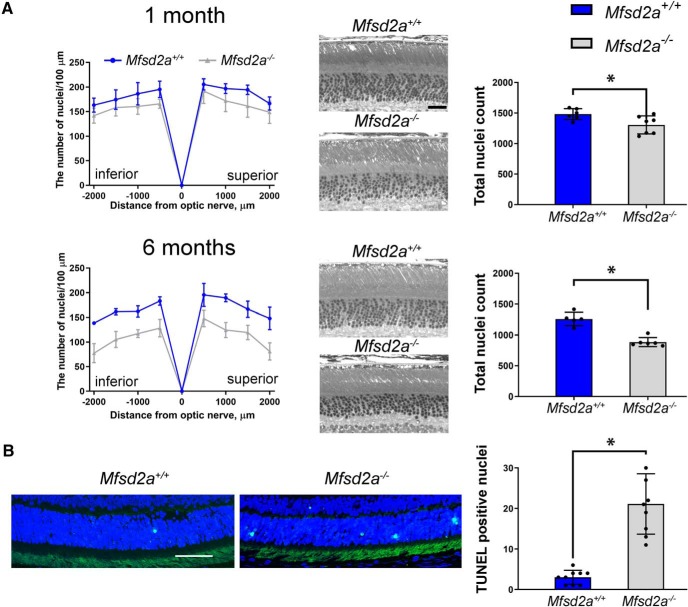
Figure 1.
Morphometric analysis of photoreceptors in Mfsd2a−/− mice. A, Left, Spider diagrams representing the number of photoreceptor nuclei in 100 μm segments of the inferior and superior retina counted at various distances from the optic nerve head. Data collected from 1- and 6-month-old Mfsd2a−/− mice and their WT littermates are shown as mean ± SD; *p ≤ 0.05. The number of eyes analyzed at 1 month was 7 Mfsd2a−/− and 6 WT; at 6 months 6 Mfsd2a−/− and 5 WT. Mouse genotypes are indicated above the panels. Middle, Representative images of superior retinal cross-sections at ∼1 mm distance from the optic nerve head. Scale bar, 25 μm. For images of representative cross-sections through the entire retinas see Figure 2. Right, The total number of nuclei in all 100 μm retinal segments presented in the spider diagrams. p = 0.028 for 1-month-old mice; p = 7.7 × 10⁻⁵ for 6-month-old mice. B, Left, Representative images of TUNEL-processed retinas from Mfsd2a−/− and WT littermate mice analyzed at 1 month of age. The green fluorescent signal represents nuclei of apoptotic cells. Right, An average number of TUNEL-positive cells per whole cross-section of Mfsd2a−/− and WT mice. At least four independently processed sections from both eyes of two mice (1 male and 1 female) for each genotype were analyzed. Data are shown as mean ± SD; p = 2 × 10⁻⁶.

