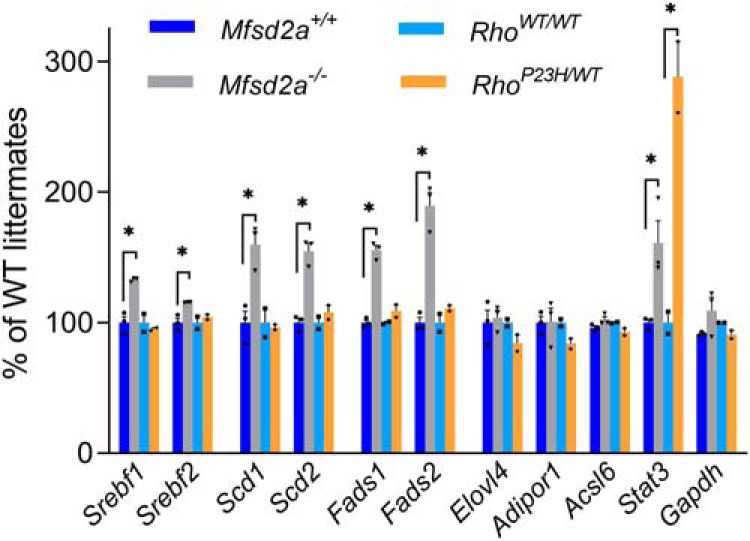
Figure 10.

Comparative analysis of selected gene expression changes in Mfsd2a−/− and RhoP23H/WT mice. Relative gene expression levels were calculated from the corresponding RPKM values. Data are shown as percentage of WT littermates for each genotype and expressed as mean ± SD (n = 3 for Mfsd2a−/−; n = 2 for RhoP23H/WT mice). Gapdh (glyceraldehyde 3-phosphate dehydrogenase) was used as a sample normalization control. Statistically significant changes (p ≤ 0.05) are marked with asterisks. For a complete dataset, see Figure 10-1, and for the enriched pathway analysis, see Figure 10-2.
