
Figure 3.
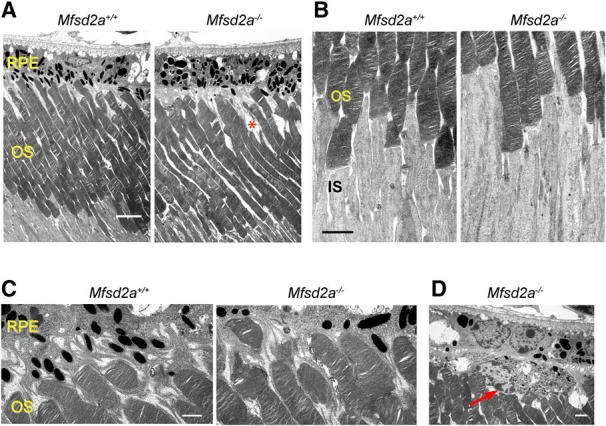
Ultrastructural analysis of Mfsd2a−/− mice. A, Electron micrographs of retinal cross-sections from 1-month-old mice of each genotype. A malformed outer segment (OS) in the Mfsd2a−/− retina is marked by an asterisk. Scale bar, 5 μm. B, A higher-magnification view of the inner segment (IS)–outer segment interface. Scale bar, 2 μm. C, A higher-magnification view of the outer segment–RPE interface. Scale bar, 1 μm. D, A microglial cell in the subretinal space of the Mfsd2a−/− mouse (red arrow). Note a nucleus on the left side and a dense cluster of phagosomes on the right side of this cell. Scale bar, 1 μm.