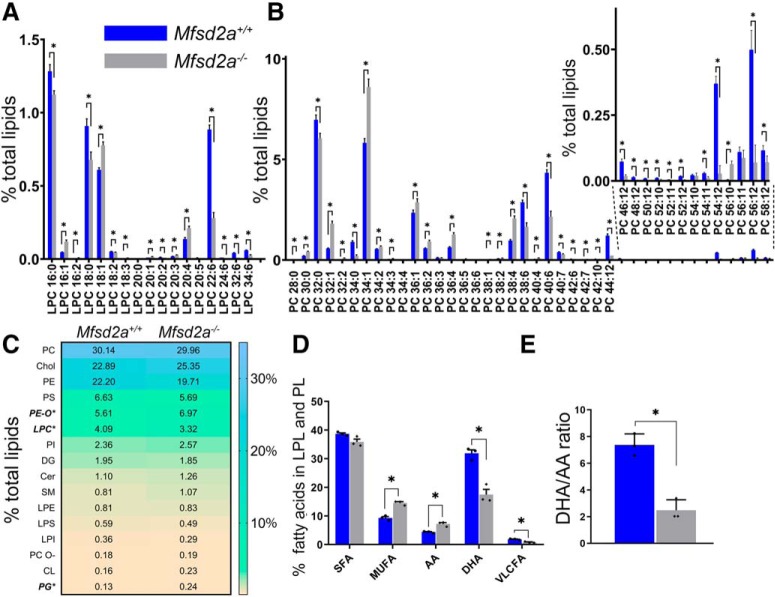
Figure 7.
Lipidomic analysis of isolated retinas from Mfsd2a−/− mice and their WT littermates. Lipid profiles for (A) lysophosphatidylcholine and (B) phosphatidylcholine shown as percentage of total amount from measured lipid classes (for complete dataset, see Figure 7-1). Statistically significant changes (p ≤ 0.05) are marked by asterisks. C, Relative representation of all measured lipid classes shown as percentage total. Three lipid classes for which the change was statistically significant between the two mouse types are marked with asterisks. The abundance of each lipid class in each dataset is color-coded with the scale shown on the right. D, Changes in the fractions of SFA, MUFA, AA, DHA, and VLCFA in Mfsd2a−/− and WT mice. Values are calculated based on the total amounts of each fatty acid type in all identified lysophospholipids (LPL) and phospholipids (PL; for complete dataset, see Figure 7-1). E, The DHA/AA molar ratios in Mfsd2a−/− and WT mice. Data are shown as mean ± SD.

