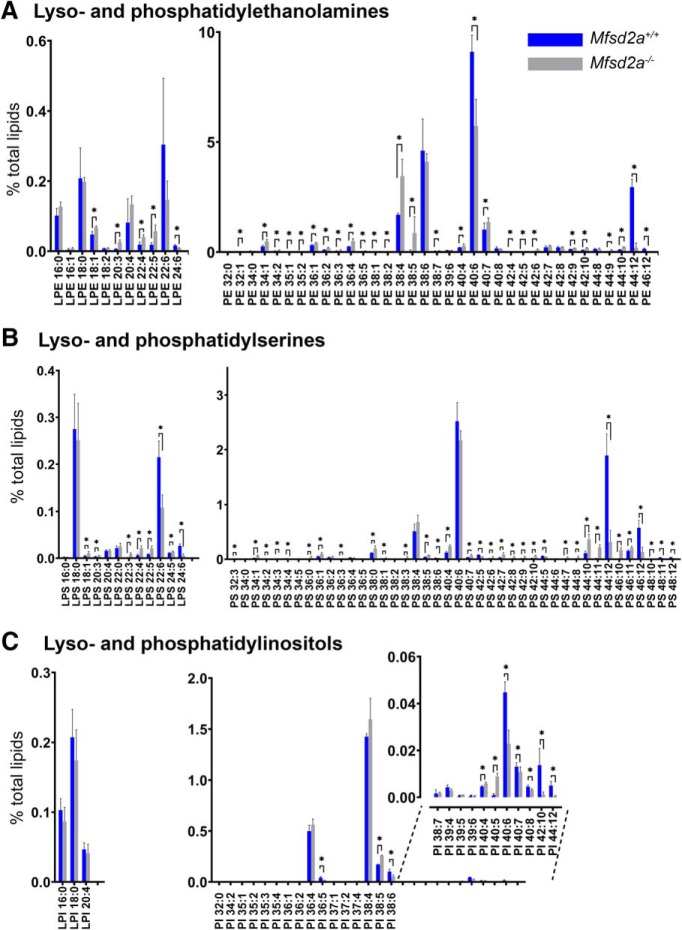
Figure 8.
Lipidomic analysis of LPE, PE, LPS, PS, LPI and PI phospholipids in isolated retinas from Mfsd2a−/− mice and their WT littermates. Lipid profiles of (A) lyso- and phosphatidylethanolamines, (B) lyso- and phosphatidylserines, and (C) lyso- and phosphatidylinositols shown as percentage of total phospholipids from all measured classes (for complete dataset, see Figure 7-1). Statistically significant changes (p ≤ 0.05) are marked by asterisks.

