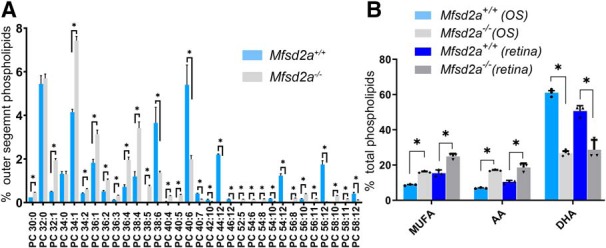
Figure 9.

Lipidomic analysis of rod outer segment preparations isolated from Mfsd2a−/− mice and their WT littermates. A, Lipid profiles for PC species shown as percentage of total outer segment phospholipid content. Only phospholipids present at the levels exceeding 0.15% of the total phospholipids content in either genotype are shown. For a complete dataset, see Figure 7-1 (tab “Major OS PL %”). B, Changes in the fractions of phospholipids containing MUFA, AA, and DHA shown as percentage of total phospholipids. The values are calculated from molar fractions of major PC, PE, PS, and PI species containing fatty acids of each type and shown as percentage of total phospholipids (Figure 7-1, tab Major OS PL %). For comparison, a similar calculation for PC, PE, PS, and PI only is performed for the whole retina and plotted side-by-side with outer segment data (Figure 7-1, tab “Major retinal PL %”). Data are shown as mean ± SD (n = 3). Statistically significant changes (p ≤ 0.05) are marked by asterisks.
