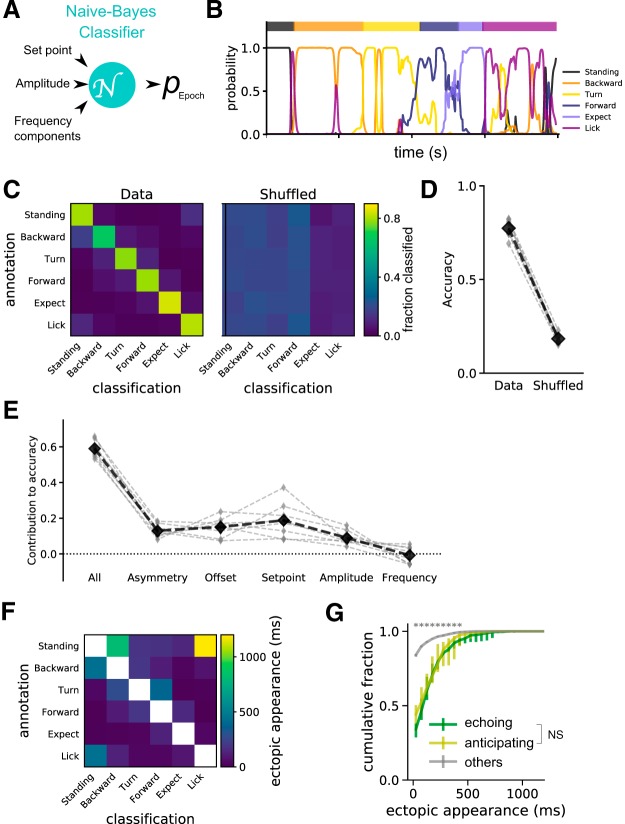
Figure 4.
Classification, decoding, and prediction of the relationship between behavior state and whisking. A, A naive-Bayes classifier with Gaussian priors was used to output the probability of a specific behavioral state (pEpoch) based on set point, amplitude, and frequency parameters of whisker motion. In total, 20 distinct classifiers were trained for each session. B, The output of probabilities in a representative trial. Individual colored lines indicate the probability output generated by the classifier for each behavioral epoch. The ground-truth behavioral epochs were annotated manually and are shown on the top of the graph. C, Confusion matrices for the classifiers. Classifiers trained with the actual dataset (left matrix) correctly classified behavioral states 80% of the time; those trained with shuffled annotations (right matrix) generated chance-level (20%) accuracy. Rows represent the categories of the manually annotated behavioral epochs used for testing the classifiers. Columns represent the categorical output from the classifier. Colors of each square represent the fraction of time points belonging to each manually annotated behavioral state. D, Accuracy of the classifiers. Gray marks indicate the scores for each session (n = 8 sessions from 5 animals). Black marks indicate the averages across sessions. p = 0.0143 (Wilcoxon Sign Rank test). E, Contribution of individual parameters to accuracy of classifiers. Asymmetry, set point, and amplitude contributed significantly to the ability of classifiers to decode the behavioral state of the animal, whereas whisking frequency generated no additional effect. Each parameter set was randomized individually, and reduction in accuracy was computed for each session. Small gray diamonds represent the changes in accuracy in individual sessions. Black diamonds represent the averages. Kruskal–Wallis test, performed for each combination of parameters, revealed significant effects for asymmetry versus frequency (*p = 0.0363), offset versus frequency (p = 0.0012), and set point versus frequency (***p < 0.0001). p > 0.1 for all other combinations (with the omnibus probability being ***p < 0.0001). F, Misclassifications. The duration/time points, where the probability was higher than the chance level, were plotted. There was a tendency that behaviorally neighboring epochs get misclassified (i.e., there was “ectopic appearance” of whisking patterns related to certain other behavioral epochs). G, Smooth transitions between behavioral epochs. The duration of above-chance probability for neighboring epochs was computed and plotted as cumulative histograms. The effects of “echoing” and “anticipating,” the effects of preceding and following behavioral epochs, respectively, were found to be significantly smaller in bins >500 ms compared with all the other types of ectopic epoch appearances. *p < 0.05 (Kruskal–Wallis test). n = 8 sessions from 5 animals. No significant difference was found between echoing and anticipating epoch appearances (p > 0.05 for all the time bins).

