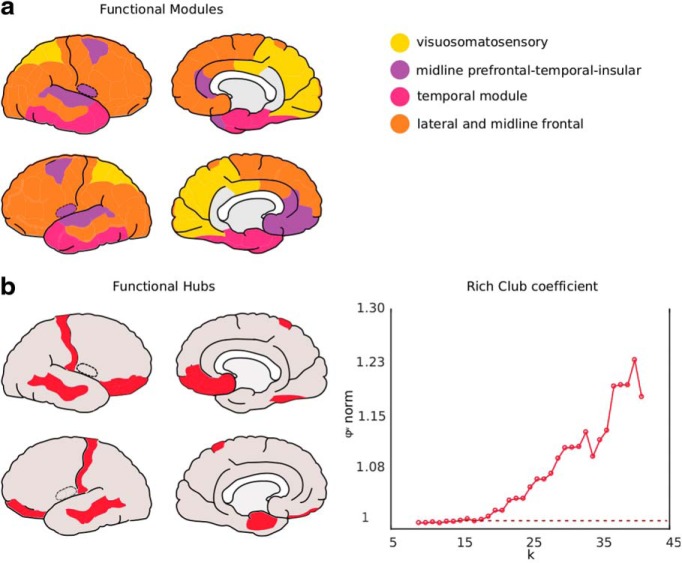
Figure 2.
Connectomic features of the fetal group matrix. a, Modular organization plotted on the fetal cortex with colors representing composition of four modules observed in fetal brain function. b, The rich-club regions in red plotted on the fetal cortex. Right, The rich-club curve (in red) is displayed with a significant rich-club organization for the range of 22 ≤ k ≤ 38 [ϕnormw(k) > 1], strongly suggesting the existence of a densely interconnected network of central hubs in the fetal connectome (van den Heuvel and Sporns, 2011).

