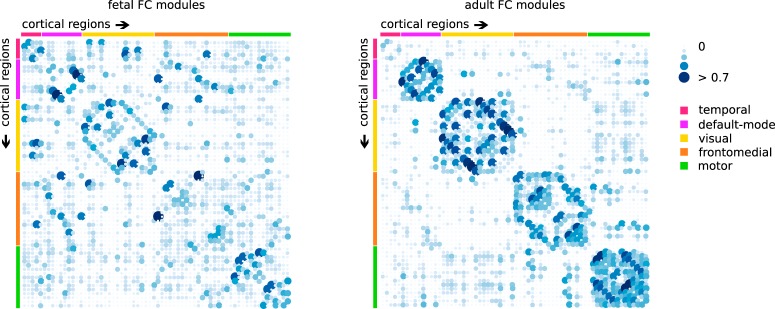
Figure 3.
Comparison of group averaged fetal and adult functional connectome modules. Illustration of the modular organization modules of the fetal (left) and adult (right) connectivity matrices. Blue dots represent positive correlations between nodes; the upper 10% of the highest connections are shown. Both matrices display the adult modular organization, revealing a temporal, default-mode, visual, frontomedial, and motor network.

