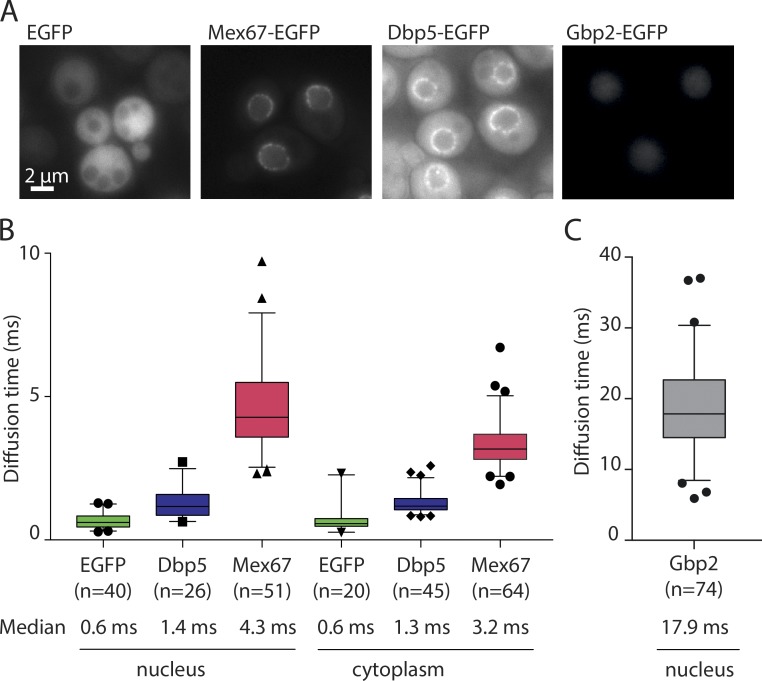
Figure 1.
Diffusion of mRNA export factors measured by FCS. (A) Representative fluorescence wide-field microscopy images of yeast strains expressing GFP-tagged mRNA export factors. Scale bar, 2 µm. (B and C) Diffusion times measured by FCS for the indicated GFP-fusion proteins. Data are pooled from three independent biological replicates. In the boxplots, the line represents the median, the box represents the 25th to 75th percentile, whiskers extend to the 5th to 95th percentile, and black symbols represent data points outside this range.

