Figure 2.
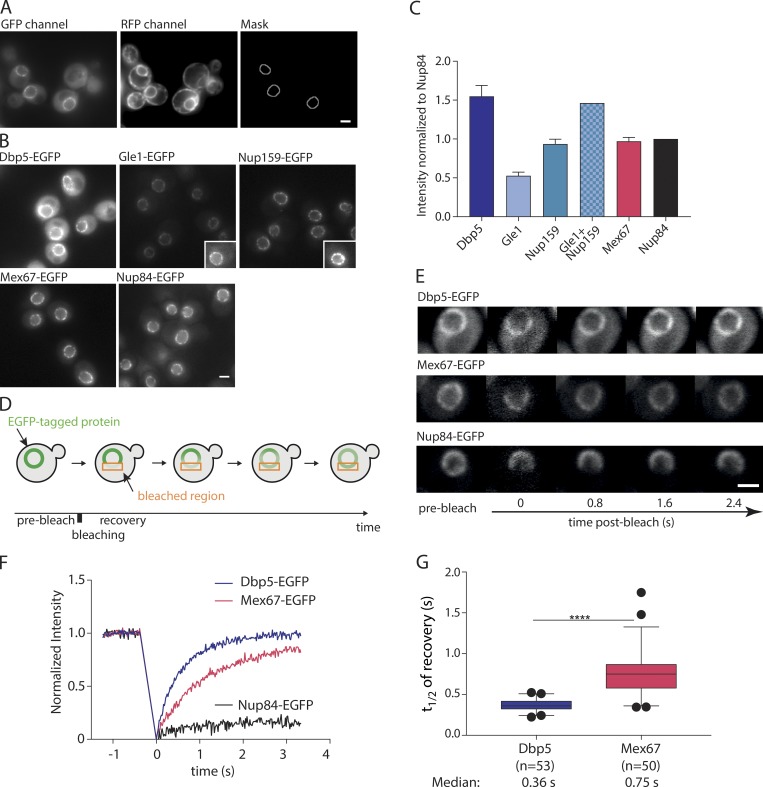
Mex67 and Dbp5 bind dynamically to the NPC. (A) Example for the production of the NuRIM analysis mask for quantification of GFP intensity on the nuclear envelope using DsRed-HDEL signal for nuclear envelope segmentation. (B) Representative fluorescence images of mRNA export factors and related Nups used for intensity analysis. Insets: Example cells with increased contrast settings for better visualization. (C) Quantification of nuclear envelope intensities by NuRIM. Bars show the means of three biological replicates, and the error bars represent the SEM. At least 1,000 cells were analyzed per condition and replicate. (D) Schematic illustration of FRAP at the nuclear envelope. (E–G) FRAP of Dbp5, Mex67, and Nup84 tagged with GFP. (E) Representative FRAP images. (F) FRAP curves normalized to prebleach and postbleach values. Mean curves of ≥50 cells are shown. (G) Half time of recovery retrieved from fitting individual FRAP curves with a single component model are plotted in boxplots. The line represents the median, the box represents the 25th to 75th percentile, and whiskers extend to the 5th to 95th percentile. ****, P < 0.001, Mann–Whitney test. Scale bars, 2 µm.

