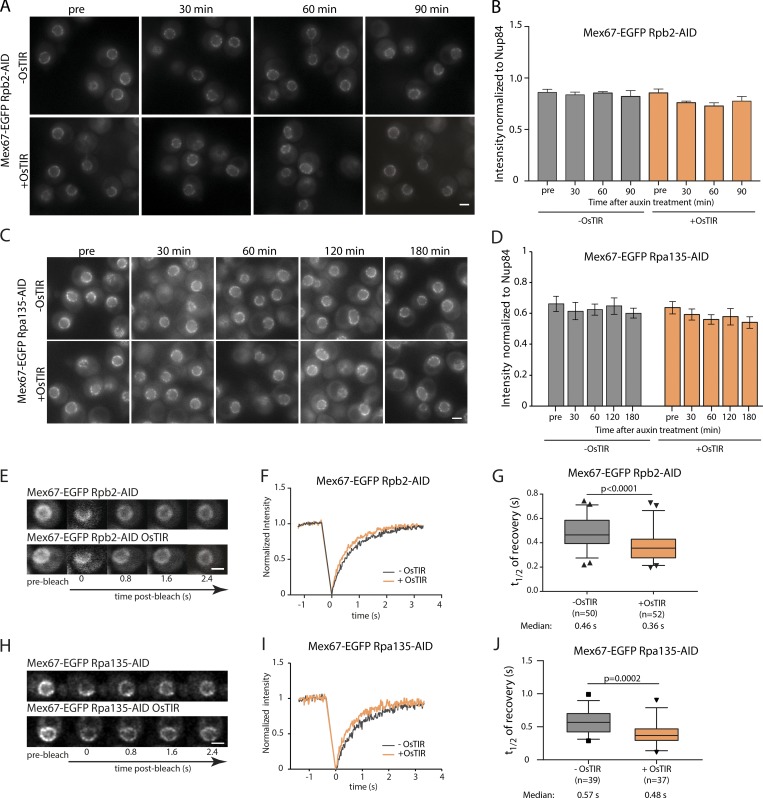
Figure 3.
Mex67 dynamics, but not its amount at the NPC, is affected by the presence of cargo molecules. (A–D) NuRIM quantification of Mex67-EGFP intensity at the nuclear envelope upon depletion of RNA Pol II (A and B) or RNA Pol I (C and D) via auxin induced degradation. (A and C) Representative wide-field fluorescence microscopy images at different times after auxin treatment. (B and D) Intensity of Mex67-EGFP at the nuclear envelope. Mean of three biological replicates is shown. Error bars represent SEM. At least 300 cells were analyzed per condition and replicate. (E–J) FRAP analysis of Mex67-EGFP dynamics at the nuclear envelope upon depletion of RNA Pol II or RNA Pol I via auxin induced degradation. (E and H) Representative images of FRAP experiments. (F and I) FRAP curves normalized to prebleach and postbleach values. Mean curves of ≥50 cells are shown. (G and J) Half time of recovery retrieved from fitting FRAP. The line represents the median, the box represents the 25th to 75th percentile, whiskers extend to the 5th to 95th percentile, and black dots represent data points outside this range. Data in F and G are pooled from three biological replicates, and data in I and J from two. P values are from a Mann–Whitney test. Scale bars, 2 µm.

