Figure 3.
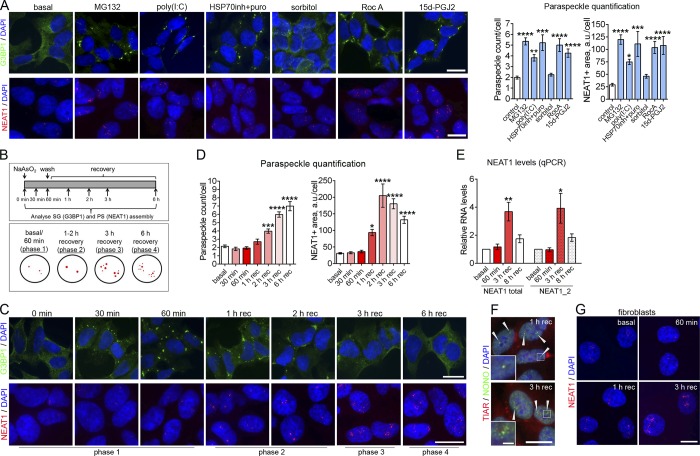
PS hyperassembly is typical for cells subjected to a SG-inducing stress. (A) Effect of SG-inducing stressors on PS assembly. Cells were treated with indicated chemicals and analyzed for SG assembly (after 2 h) and for PS assembly (after 4 h). Cells were also transfected with poly(I:C) and analyzed for SG assembly after 6 h and for PS assembly after 8 h. SGs were visualized with anti-G3BP1 staining and PSs using NEAT1 RNA-FISH. 112–299 cells were included in analysis per condition. ***, P < 0.001; ****, P < 0.0001 (one-way ANOVA with Holm–Sidak’s test). (B) Timeline for SG and PS analysis during NaAsO2 treatment (top panel) and phases of PS assembly identified at these time points (bottom panel; NEAT1 signal is depicted in red). (C and D) Dynamics of SG and PS assembly in NaAsO2-treated cells. Representative images (C) and quantitation (D) are shown. SGs were visualized with anti-G3BP1 staining and PSs using NEAT1 RNA-FISH. In D, 87–235 cells were included into analysis per condition. *, P < 0.05; ***, P < 0.001; ****, P < 0.0001 (one-way ANOVA with Dunnett’s test). (E) NEAT1 levels during NaAsO2 stress as measured by qRT-PCR (n = 4). *, P < 0.05; **, P < 0.01 (Mann–Whitney U test). (F) Recruitment of a core PSP NONO into NaAsO2-induced PSs after 1 and 3 h of recovery (phases 2 and 3, respectively). Arrowheads indicate PS clusters. (G) PS assembly in human fibroblasts during the recovery from NaAsO2 stress. PSs were visualized using NEAT1 RNA-FISH. In A, C, F, and G, representative images are shown. Error bars represent SEM. Scale bars, 10 µm; inset in F, 2 µm.

