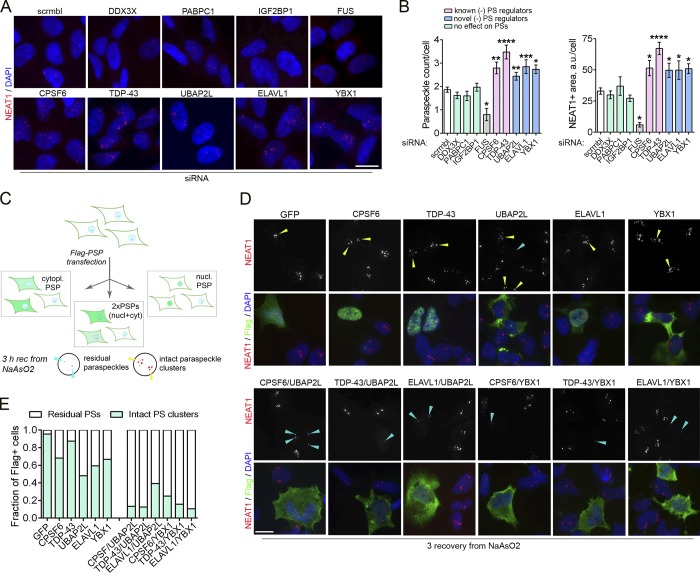
Figure 5.
Overabundance of proteins acting as negative regulators of PS formation disrupts PS hyperassembly during stress. (A and B) Depletion of certain PSPs leads to increased PS numbers under basal conditions. Cells were transfected with a respective siRNA or scrambled (scrmbl) control RNA and analyzed 48 h after transfection. Representative images (A) and quantification of PS numbers/area (B) are shown. Also see Fig. S3 A. 68–264 cells were included in the analysis per condition. Cells depleted of FUS are known to lose PSs and were included as a negative control. *, P < 0.05; **, P < 0.01; ****, P < 0.0001 (one-way ANOVA with Dunnett’s test). Error bars represent SEM. Scale bar, 10 µm. (C–E) Increasing cellular levels of two negative regulators of PS formation simultaneously, by expression of Flag-tagged proteins disrupts PS hyperassembly during NaAsO2-induced stress. Experimental design is schematically shown in C. nucl, nuclear; cyt/cytopl, cytoplasmic. Cells were transfected with respective plasmids, left to express the proteins for 24 h, treated with NaAsO2, and allowed to recover (rec) for 3 h, followed by PS analysis using NEAT1 RNA-FISH. A predominantly cytoplasmic protein was coexpressed with a predominantly nuclear protein to be able to identify the coexpressing cells. GFP tagged with Flag was used as a control. Representative images (D) and quantification (E) are shown. In D, yellow arrowheads point to intact stress-induced PS clusters, and blue arrowheads, to residual PS clusters. Scale bar, 10 µm.

