Figure 3.
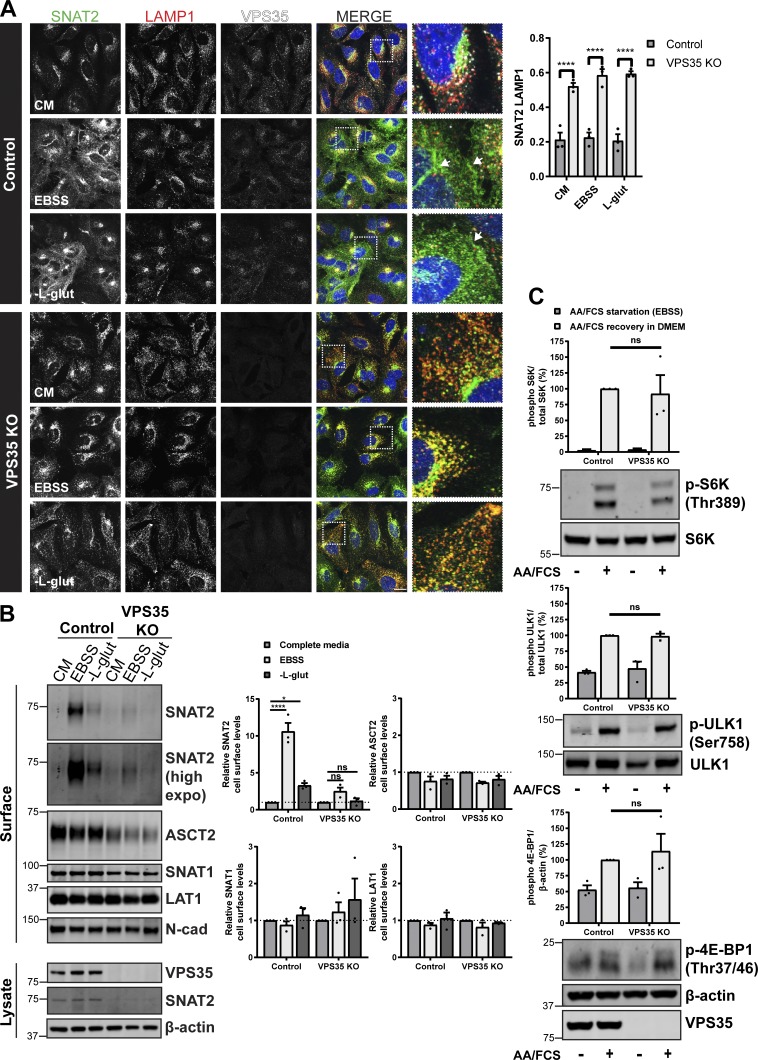
Retromer is required for cellular adaptation to nutrient insufficiency. (A) IF analysis of SNAT2 (green), LAMP1 (red), and VPS35 (white) in control and VPS35 knockout HeLa cells following overnight (16 h) amino acid starvation (EBSS), L-glutamine starvation, or incubation in complete media (CM). Arrows indicate the redistribution of SNAT2 to the cell periphery. Bars represent mean ± SEM. Pearson’s correlation; n = three independent experiments with >100 cells per condition; two-way ANOVA followed by Sidak’s multiple comparison. Scale bar, 20 µm. (B) Control and VPS35 knockout HeLa cells were subjected to overnight (16 h) amino acid starvation (EBSS), L-glutamine starvation, or maintained in complete media (CM). Cells were surface biotinylated, and streptavidin agarose was used to capture biotinylated membrane proteins. Surface abundance of the indicated proteins was assessed by quantitative immunoblotting. The quantification shows the mean ± SEM; n = three independent experiments; two-way ANOVA followed by Dunnett’s multiple comparison. (C) Representative immunoblots showing the levels of phosphorylated S6K, ULK1, and 4E-BP1 in control and VPS35 KO cells starved with EBSS for 50 min and then stimulated with complete 1× amino acids and FCS containing DMEM (+) or maintained in EBSS for 10 min (−). Graphs represent the quantification of three independent experiments. Error bars denote ±SEM. (A and B) *P < 0.05; ****P < 0.0001. KO, knockout.

