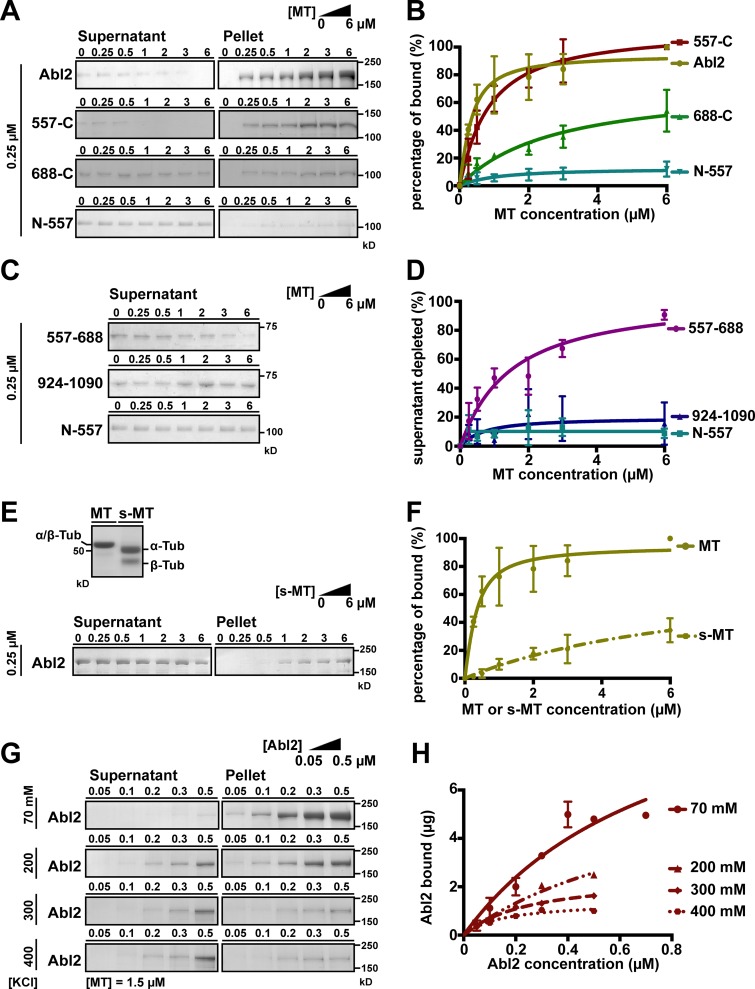
Figure 1.
Abl2 used C-terminal regions to bind MTs and removal of the tubulin E-hook impairs Abl2:MT interaction. (A) A fixed concentration of 0.25 µM Abl2, Abl2-557-C, Abl2-688-C, or Abl2-N-557 was mixed with 0–6 µM MTs. The mixture was pelleted by high-speed centrifugation, and all of the pellet and one third of the supernatant were separated by SDS-PAGE. The amounts of Abl2 or Abl2 fragments in the supernatant and pellet were quantified by densitometry. Results are shown in B. The original gels are shown in Fig. S1, A–D. (C) Supernatant depletion of Abl2 fragments was used to infer MT binding. 0.25 µM Abl2-557-688 or Abl2-924-1090 was mixed with 0–6 µM MTs, then treated as in A. Results are shown in D. The original gels are shown in Fig. S1, H and I. (E) Equal amounts (16 µg) of MT or s-MT are shown on the SDS-PAGE. A fixed concentration of 0.25 µM Abl2 was mixed with 0–6 µM s-MTs, then treated as in A. Results are shown in F. The original gels are shown in Fig. S1 J. (G) A fixed concentration of 1.5 µM MT was mixed with 0.05–0.5 µM Abl2 and 70–400 mM KCl, then treated as in A. The amount of Abl2 recovered from pellet fraction versus Abl2 concentrations used in the assay is shown in H. The original gels are shown in Fig. S1, K–P. Error bars are presented as mean ± SD 5 ≤ n ≤ 7. The R2 values of curve fitting for Abl2 = 0.88, 557-C = 0.95, 688-C = 0.85, N-688 = 0.84, and 557–688 = 0.89. Tub, tubulin.

