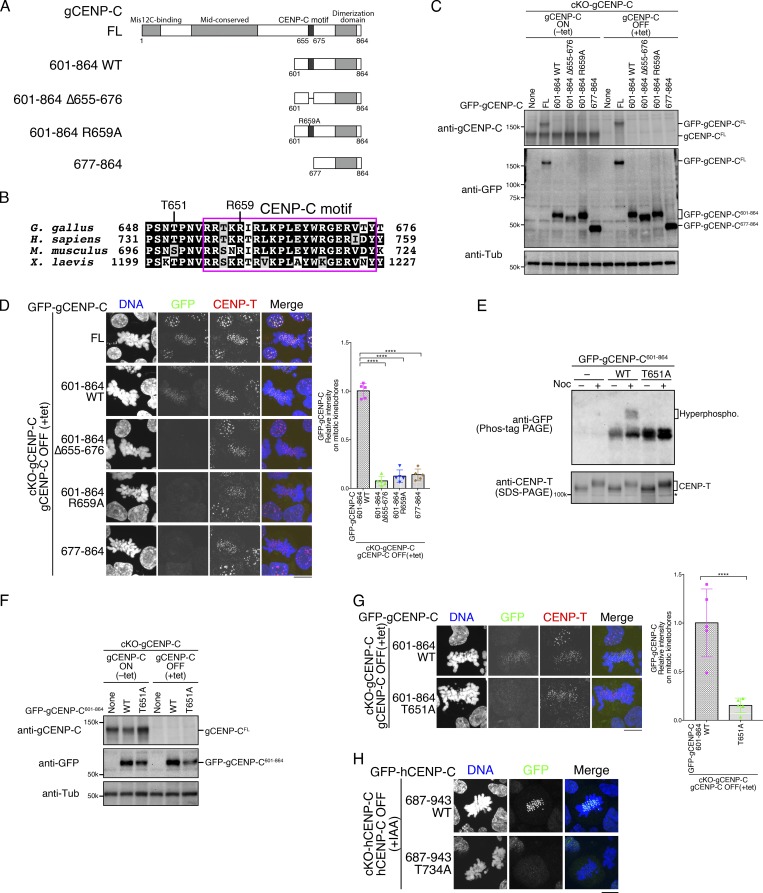
Figure 1.
CENP-C phosphorylation near the CENP-C motif is required for mitotic kinetochore localization of the CENP-C C-terminal fragment. (A) Schematic representation of gCENP-C. gCENP-C contains 864 aa (gCENP-CFL), the gCENP-C C-terminal fragment (gCENP-C601–864 WT), and its mutants (gCENP-C601–864 Δ655–676, gCENP-C601–864 R659A, and gCENP-C677–864). (B) Amino acid sequence alignment of the CENP-C C-terminal region. The magenta box indicates the CENP-C motif. (C) Expression of full-length WT gCENP-C (gCENP-CFL) was conditionally turned off by tet addition in gCENP-C cKO (cKO-gCENP-C) cells (None). GFP-fused gCENP-C full-length, gCENP-C601–864 WT, and its mutants (full length [FL] 601–864 WT, 601–864 Δ655-676, 601–864 R659A, and 677–864) were stably expressed in cKO-gCENP-C cells. These cells were cultured in the presence or absence of tet (+tet: CENP-C OFF or −tet: CENP-C ON) for 48 h. α-Tubulin (Tub) was probed as a loading control. (D) Localization of GFP-fused gCENP-CFL, gCENP-C 601–864, gCENP-C 601–864 Δ655–676, gCENP-C 601-864 R659A, and gCENP-C 677-864 in mitotic and interphase cKO-gCENP-C cells at 48 h after addition of tet (green). CENP-T was stained as a kinetochore marker (red). DNA was stained by DAPI (blue). Scale bar indicates 10 µm. GFP signals on kinetochores in mitotic cells were quantified. Bar graph indicates mean with SD (n = 5; ****, P < 0.0001; NS, P > 0.05; unpaired t test, two tailed). See also Fig. S3 A. (E) Phos-tag PAGE analysis of GFP-fused gCENP-C601–864 WT or T651A in cKO-gCENP-C cells enriched in mitosis by nocodazole (Noc) treatment. CENP-T was examined using SDS-PAGE as a control for phosphorylation in mitotic-arrested cells. cKO-CENP-C without GFP-gCENP-C601–864 expression was also analyzed (None). Asterisk shows a nonspecific signal. See also Fig. S1 B. (F) Expression of GFP-fused gCENP-C 601–864 T651A in cKO-gCENP-C cells. The cells shown were cultured in the presence or absence of tet (+tet: gCENP-C OFF or −tet: gCENP-C ON) for 48 h. α-Tubulin was probed as a loading control. (G) Localization of GFP-fused gCENP-C601–864 WT and gCENP-C601–864 T651A in mitotic and interphase cKO-gCENP-C cells at 48 h after addition of tet (green). CENP-T was stained as a kinetochore marker (red), and DNA was stained by DAPI (blue). Scale bar indicates 10 µm. GFP signals on kinetochores in mitotic cells were quantified. Bar graph indicates mean with SD (n = 5; ****, P < 0.0001; NS, P > 0.05, unpaired t test, two tailed). See also Fig. S3 B. (H) Localization of GFP-fused hCENP-C687-943 WT and hCENP-C687-943 T734A in mitotic and interphase cKO-hCENP-C RPE-1 cells (green). Full-length WT hCENP-C (hCENP-C-AID-mCherry) was conditionally degraded by IAA. The cells were cultured in the presence of IAA (+IAA: hCENP-C OFF) for 48 h. DNA was stained with DAPI (blue). Scale bar indicates 10 µm. See also Fig. S1, C–E.

