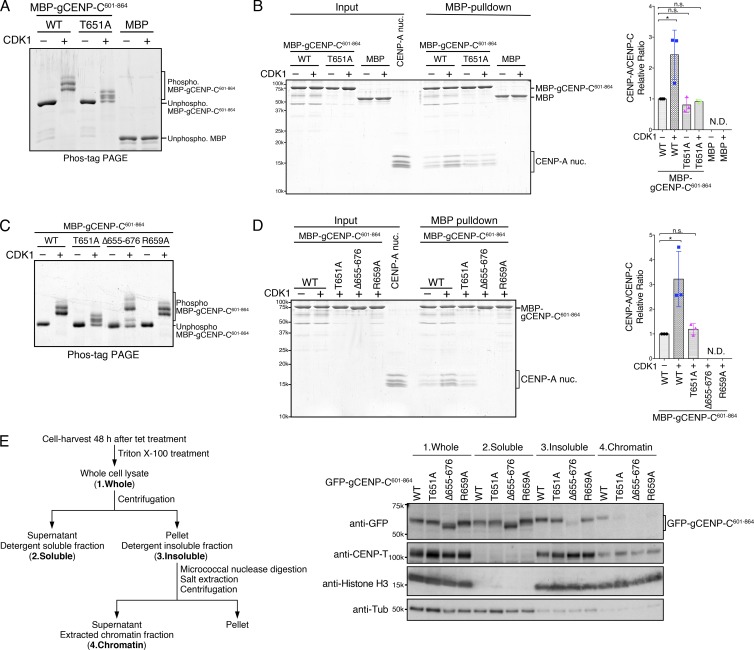
Figure 2.
T651 phosphorylation of the gCENP-C C-terminal fragment facilitates its binding to the CENP-A nucleosome in vitro. (A) Phos-tag PAGE analysis of purified MBP fused to gCENP-C601–864 WT (WT) and gCENP-C601–864 T651A (T651A) phosphorylated by CDK1. MBP was used as a negative control. Unphosphorylated proteins were also examined. See also Fig. S1 F. (B) MBP pull-down of CENP-A nucleosomes with MBP-gCENP-C601–864 WT or T651A. The phosphorylated or unphosphorylated MBP-gCENP-C601–864 and the chicken CENP-A nucleosome (CENP-A nuc.; input) were incubated and pulled down by MBP (MBP-pulldown). The signal intensities of all histones in CENP-A nucleosomes, which were precipitated with MBP proteins, were quantified. The signal intensities were normalized to MBP-gCENP-C601–864 (CDK1−) signals. Bar graph indicates mean with SD (n = 3; *, P < 0.05, unpaired t test, two tailed). See also Fig. S1, G and H. (C) Phos-tag PAGE analysis of purified MBP-gCENP-C601–864 WT, T651A, Δ655–676, and R659A phosphorylated by CDK1. Unphosphorylated proteins were also examined. See also Fig. S1 I. (D) MBP pull-down of the CENP-A nucleosome with MBP-gCENP-C601–864 WT and its mutants phosphorylated by CDK1. Each protein was phosphorylated by CDK1, as in C. MBP pull-down and signal quantification performed as in B. Bar graph indicates mean with SD (n = 3; *, P < 0.05, unpaired t test, two tailed). (E) cKO-gCENP-C cells expressing the indicated GFP-gCENP-C601–864 proteins were fractionated (left scheme) and examined by immunoblotting (right panels). CENP-T and histone H3 were used as controls for the insoluble and chromatin fractions. α-Tubulin (Tub) was used as a control for the soluble fraction.

