Figure 4.
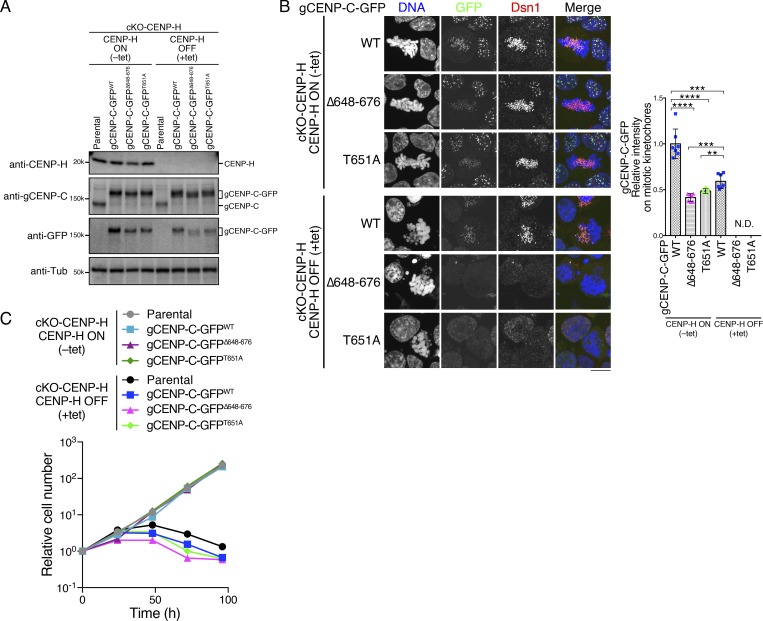
Mitotic kinetochore localization of gCENP-C depends on both the CENP-A and CENP-H complex in DT40 cells. (A) Expression of each GFP-fused gCENP-C and CENP-H in CENP-H cKO (cKO-CENP-H) cells cultured in the presence or absence of tet (+tet: CENP-H OFF or −tet: CENP-H ON) for 48 h by immunoblotting. Parental cKO-CENP-H cells were also examined. α-Tubulin (Tub) was probed as a loading control. See also Fig. S2, A and C. (B) Localization of gCENP-C-GFP WT and its mutants shown in A in cKO-CENP-H cells (green). Dsn1 was stained as a kinetochore marker (red), and DNA was stained by DAPI (blue). Scale bar indicates 10 µm. The GFP signals on kinetochores in mitotic cells were quantified. Bar graph indicates mean with SD (n = 7; ****, P < 0.0001; ***, P < 0.001; **, P < 0.01; NS, P > 0.05, unpaired t test, two tailed). See also Fig. S3 E. (C) Growth of cKO-CENP-H cells expressing GFP-fused gCENP-C WT, Δ648–676, or T651A. Cell numbers were examined at the indicated time after tet addition (+tet: CENP-H OFF) and were normalized to those at 0 h for each line. Untreated cells were also examined (−tet: CENP-H ON). Each graph shows results of one experiment.

