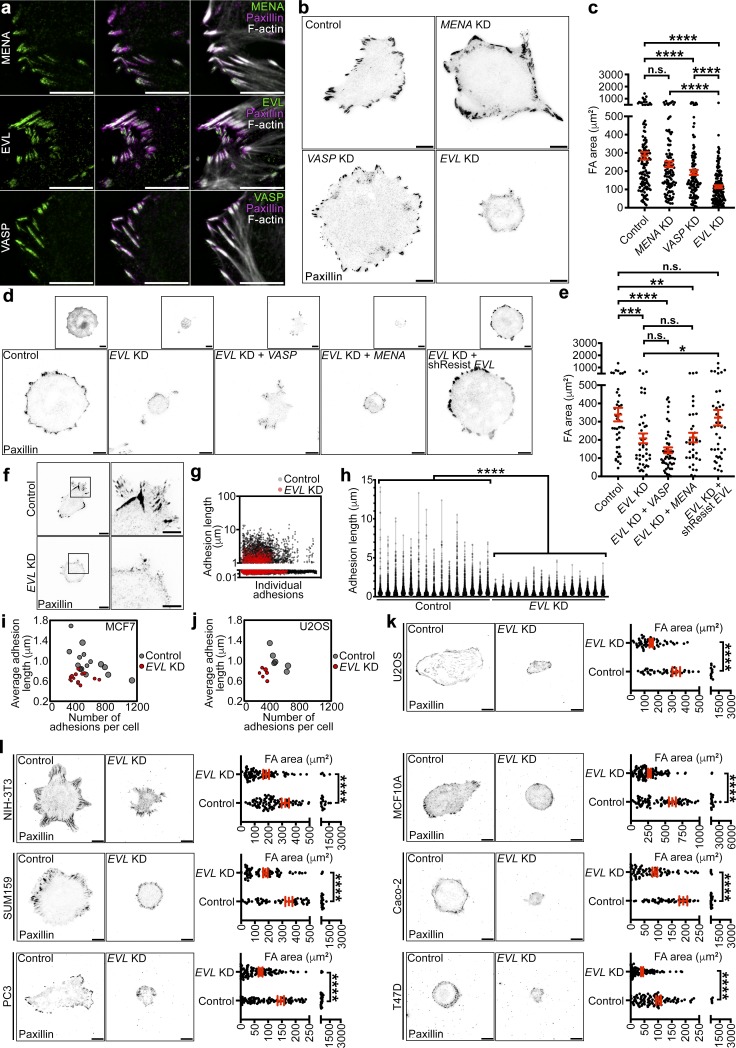
Figure 2.
EVL is required for cell-matrix adhesion and FA maturation. (a) Left: Immunofluorescent staining of MENA, EVL, and VASP in MCF7 cells. Middle: Immunofluorescent staining of paxillin shown with Ena/VASP. Right: Paxillin and Ena/VASP shown with phalloidin staining. Scale bars are 5 µm. (b) Representative inverted TIRF images of paxillin staining in control (LKO vector), MENA KD, VASP KD, and EVL KD MCF7 cells. Scale bars are 10 µm. (c) Dot plot shows quantification of FA area. Data are collected from three independent experiments; all data points are shown (n ≥ 118 per condition; P values were determined using regression analysis; ****, P ≤ 0.0001; n.s., not significant; exact P values for all two-way comparisons are found in Table S3; mean ± SEM). (d) Representative inverted TIRF images of paxillin staining from control (LKO vector) + GFP, EVL KD + GFP, EVL KD + GFP-VASP, EVL KD + GFP-MENA, and EVL KD + GFP-shResistEVL MCF7 cells. Boxed insets are inverted images of expression constructs. Scale bars are 10 µm. (e) Dot plot shows quantification of FA area. Data are collected from three independent experiments; all data points are shown (n ≥ 35 per condition; P values were determined using regression analysis; *, P ≤ 0.05; **, P ≤ 0.01; ***, P ≤ 0.001; ****, P ≤ 0.0001; n.s., not significant; exact P values for all two-way comparisons are found in Table S3; mean ± SEM). (f) Left: Representative inverted TIRF images of paxillin staining in control (LKO vector) and EVL KD cells used in FA length quantification. Scale bars are 10 µm. Right: Magnified views of boxed areas from paxillin images. Scale bars are 5 µm. (g) Scatter plot shows individual FA length measurements from control and EVL KD cells. The lengths of >6,000 FAs from 15 cells per condition were measured; all data points are shown. (h) Volcano plot shows distribution of FA lengths in individual cells; all data points are shown (n ≥ 6,014 per condition; P values were determined using regression analysis; ****, P ≤ 0.0001; n.s., not significant; volcano plot shows median and quartiles of FA lengths; exact P values are found in Table S2). (i) Bubble plot shows mean FA length and number of FAs in individual control and EVL KD cells. Bubble area is scaled to total FA area. More than 6,000 FAs from 15 cells per condition were quantified; all cells are shown. (j) Bubble plot shows mean FA length and number of FAs in individual control and EVL KD U2OS cells. Bubble area is scaled to total FA area. More than 1,600 FAs from six cells per condition were quantified; all cells are shown. (k) Representative inverted TIRF images of paxillin staining in control (LKO vector) and EVL KD U2OS cells with corresponding quantification. Scale bars are 10 µm. Dot plots show quantification of FA area. Data are collected from three independent experiments; all data points are shown (n ≥ 52 per condition; P values were determined using regression analysis; ****, P ≤ 0.0001; n.s., not significant; exact P values are found in Table S2; mean ± SEM). (l) Representative inverted TIRF images of paxillin staining in a panel of control (LKO vector) and EVL KD cells with corresponding quantification. Scale bars are 10 µm. Dot plots show quantification of FA areas from cell panel. Data are collected from three independent experiments per cell line; all data points are shown (n ≥ 76 per condition; P values were determined using regression analysis; ****, P ≤ 0.0001; n.s., not significant; exact P values are found in Table S2; mean ± SEM).

