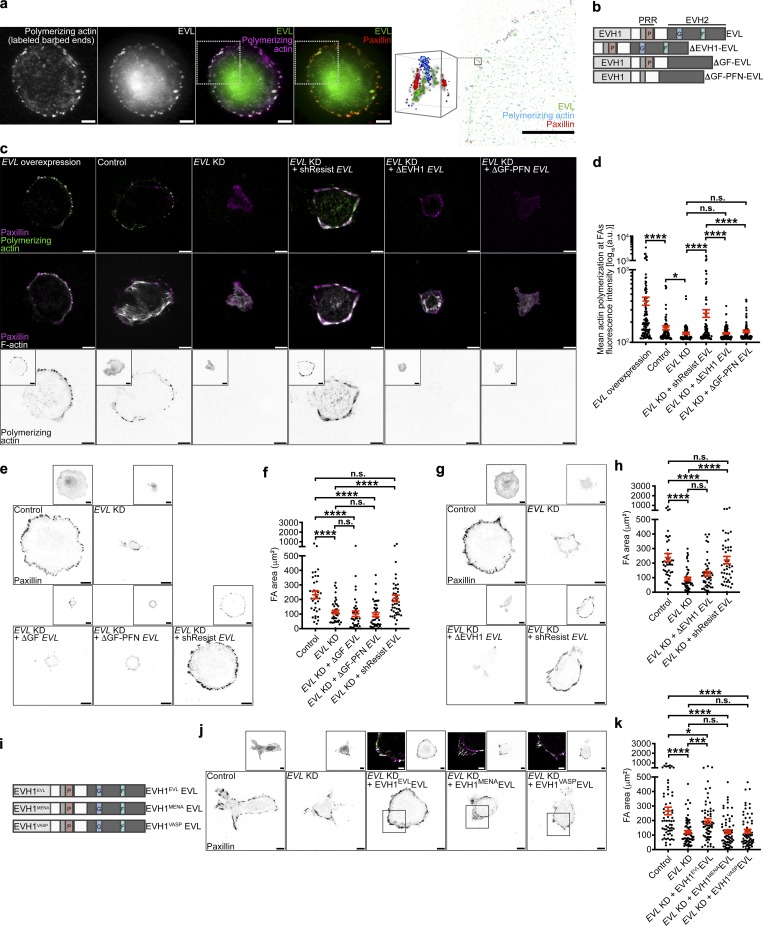
Figure 3.
EVL polymerizes actin at FAs, which regulates cell-matrix adhesion and promotes FA maturation. (a) Representative N-STORM image of in situ actin polymerization in MCF7 cells expressing GFP-EVL. Left: TIRF images of exogenously introduced actin, GFP-EVL, GFP-EVL and exogenously introduced actin, and GFP-EVL and paxillin staining. Scale bars are 10 µm. White boxes denote region of interest. Right: N-STORM image of GFP-EVL, exogenous actin, and paxillin within region of interest taken from white boxes on TIRF images. Scale bar is 10 µm. Magnified cube is 3D view of N-STORM imaging of GFP-EVL, exogenous actin, and paxillin from boxed inset. Cube is 1 µm3. (b) Illustration depicting domains for full-length EVL and EVL domain deletion mutants (see Table S1 for sequences). (c) Representative TIRF images of barbed end labeled control (LKO vector) + GFP-EVL, control + GFP, EVL KD + GFP, EVL KD + GFP-shResist EVL, EVL KD + GFP-ΔEVH1 EVL, and EVL KD + GFP-ΔGF-PFN EVL MCF7 cells after in situ actin polymerization assays. Top: Exogenously introduced actin with paxillin staining. Middle: Phalloidin staining with paxillin. Bottom: Inverted single-channel images of exogenous actin incorporation shown for clarity. Boxed insets are inverted images of expression constructs. Scale bars are 10 µm. (d) Dot plot shows quantification of exogenous actin fluorescence intensity within paxillin regions. Data are collected from three independent experiments; all data points are shown (n ≥ 82 per condition; P values were determined using regression analysis; *, P ≤ 0.05; ****, P ≤ 0.0001; n.s., not significant; exact P values for all two-way comparisons are found in Table S3; mean ± SEM). (e) Representative inverted TIRF images of paxillin staining in control (LKO vector) + GFP, EVL KD + GFP, EVL KD + GFP-ΔGF EVL, EVL KD + GFP-ΔGF-PFN EVL, and EVL KD + GFP-shResist EVL in MCF7 cells. Boxed insets are inverted images of expression constructs. Scale bars are 10 µm. (f) Dot plot shows quantification of FA area. Data are collected from three independent experiments; all data points are shown (n ≥ 37 per condition; P values were determined using regression analysis; ****, P ≤ 0.0001; n.s., not significant; exact P values for all two-way comparisons are found in Table S3; mean ± SEM). (g) Representative inverted TIRF images of paxillin staining in control (LKO vector) + GFP, EVL KD + GFP, EVL KD + GFP-ΔEVH1 EVL, and EVL KD + GFP-shResist EVL in MCF7 cells. Boxed insets are inverted images of expression constructs. Scale bars are 10 µm. (h) Dot plot shows quantification of FA area. Data are collected from three independent experiments; all data points are shown (n ≥ 44 per condition; P values were determined using regression analysis; ****, P ≤ 0.0001; n.s., not significant; exact P values for all two-way comparisons are found in Table S3; mean ± SEM). (i) Illustration depicting domains for full-length EVL (EVH1EVLEVL) and EVH1 chimeric mutants, EVH1MENAEVL and EVH1VASPEVL (see Table S1 for sequences). (j) Representative inverted TIRF images of paxillin staining in control (LKO vector) + GFP, EVL KD + GFP, EVL KD + GFP-EVH1EVLEVL, EVL KD + GFP-EVH1MENAEVL, and EVL KD + GFP-EVH1VASPEVL in MCF7 cells. Scale bars are 10 µm. Inverted insets are of expression constructs, and overlay insets show expression construct with paxillin. Scale bars are 5 µm in overlay insets. (k) Dot plot shows quantification of FA area. Data are collected from three independent experiments; all data points are shown (n ≥ 62 per condition; P values were determined using regression analysis; *, P ≤ 0.05; ***, P ≤ 0.001; ****, P ≤ 0.0001; n.s., not significant; exact P values for all two-way comparisons are found in Table S3; mean ± SEM).

