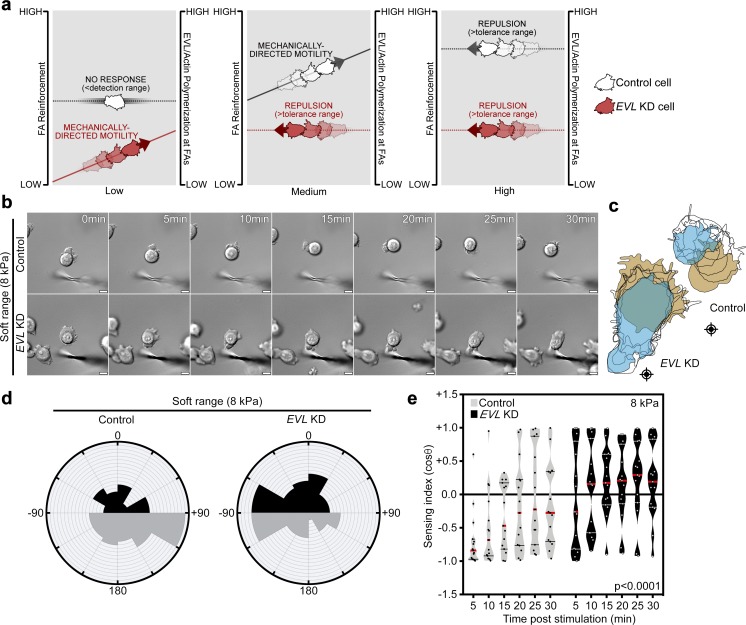
Figure 6.
Working model suggesting that FA actin polymerization is proportionally required to the force demands of the microenvironment. (a) EVL-mediated FA actin polymerization is required for FA reinforcement in response to increasing environmental forces. Left (gray line): Low mechanical forces are below a cell’s mechanical detection range if cells have preexisting FA actin above the threshold required for FA stability. In these cases, no directional response is elicited and FAs remain at steady state. Left (red line): Low mechanical forces may be within the sensing range if cells do not have sufficient preexisting FA actin for FA stability upon stimulation. In these cases, mechanical stimulation promotes an increase in FA actin polymerization and induces mechanically directed motility. Middle (gray line): Moderate mechanical forces may be within the sensing range of cells with higher baseline FA actin if they do not have sufficient preexisting FA actin for FA stability upon stimulation. In these cases, mechanical stimulation promotes an increase in FA actin polymerization and induces mechanically directed motility. Middle (red line): Moderate mechanical forces may be above the tolerance range of cells with low capacity to dynamically polymerize sufficient FA actin, which leads to force-mediated de-adhesion and directional repulsion. Right (gray and red lines): High mechanical forces that exceed the capacity of cells to dynamically polymerize sufficient FA actin leads to force-mediated de-adhesion and repulsion. (b–e) Control (LKO vector) and EVL KD MCF7 cells, plated on 8-kPa hydrogels, were mechanically stimulated. (b) Still images from representative time-lapse videos of control and EVL KD cells (Video 7). Scale bars are 10 µm. (c) Corresponding cell traces at 0, 5, 10, 15, 20, 25, and 30 min, with starting positions in tan and final positions in blue. Crosshairs denote micropipette positions. (d) Rose plots show cumulative turning angles for control and EVL KD cells. Black sectors denote turns in the direction of the force gradient, and gray sectors denote turns away from the force gradient. Data are collected from four independent experiments (n = 15 per condition). (e) Sensing indices of control and EVL KD cells over time. Two-way ANOVA shows a significant difference in sensing index between control and EVL KD cells (P < 0.0001). Data are collected from four independent experiments; all data points are shown (n = 15 per condition; violin plot shows median and quartiles of sensing indices).

