Figure 8.
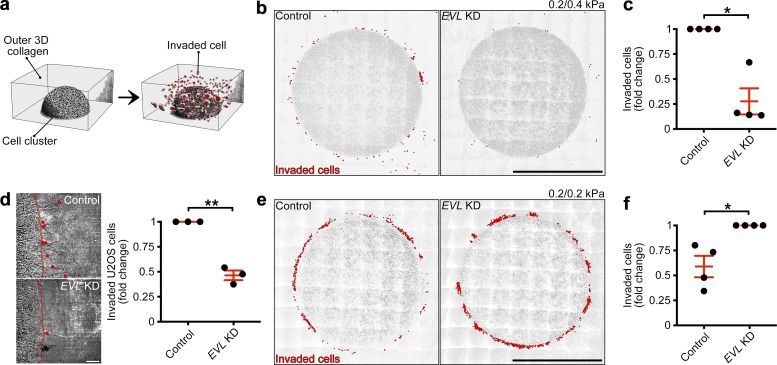
EVL promotes durotactic invasion within 3D matrix. (a) Illustration depicting 3D invasion assays. (b and c) Control (LKO vector) and EVL KD MCF7 cells were plated within a durotactic invasion assay. (b) Large-stitch images of control and EVL KD invasion assays, with red dots denoting invaded cells. Scale bars are 500 µm; 0.2 and 0.4 kPa correspond to inner and outer matrices, respectively. (c) Quantification of cells invaded from 0.2–0.4-kPa matrix. Data are expressed as fold change and are collected from four independent experiments; all experiments are shown (n = 4 per condition; P values were determined using a one-sample t test with a hypothetical value of 1; *, P ≤ 0.05; n.s., not significant; exact P values are found in Table S2; mean ± SEM). (d) Control (LKO vector) and EVL KD U2OS cells were plated within a durotactic invasion assay. Left: Still images from time-lapse videos of invading control and EVL KD U2OS cells, with red lines denoting boundaries between inner and outer matrices and red dots denoting invaded cells; images are taken from final time point of Video 9. Scale bars are 50 µm. Right: Quantification of cells invaded from 0.2–0.4-kPa matrix. Data are expressed as fold change and are collected from three independent experiments; all experiments are shown (n = 3 per condition; P values were determined using a one-sample t test with a hypothetical value of 1; **, P ≤ 0.01; n.s., not significant; exact P values are found in Table S2; mean ± SEM). (e and f) Control (LKO vector) and EVL KD MCF7 cells were plated within a soft invasion assay. (e) Large-stitch images of control and EVL KD invasion assays, with red dots denoting invaded cells. Scale bars are 500 µm; 0.2 and 0.2 kPa correspond to inner and outer matrices, respectively. (f) Quantification of cells invaded from 0.2–0.2-kPa matrix. Data are expressed as fold change and are collected from four independent experiments; all experiments are shown (n = 4 per condition; P values were determined using a one-sample t test with a hypothetical value of 1; *, P ≤ 0.05; n.s., not significant; exact P values are found in Table S2; mean ± SEM).

