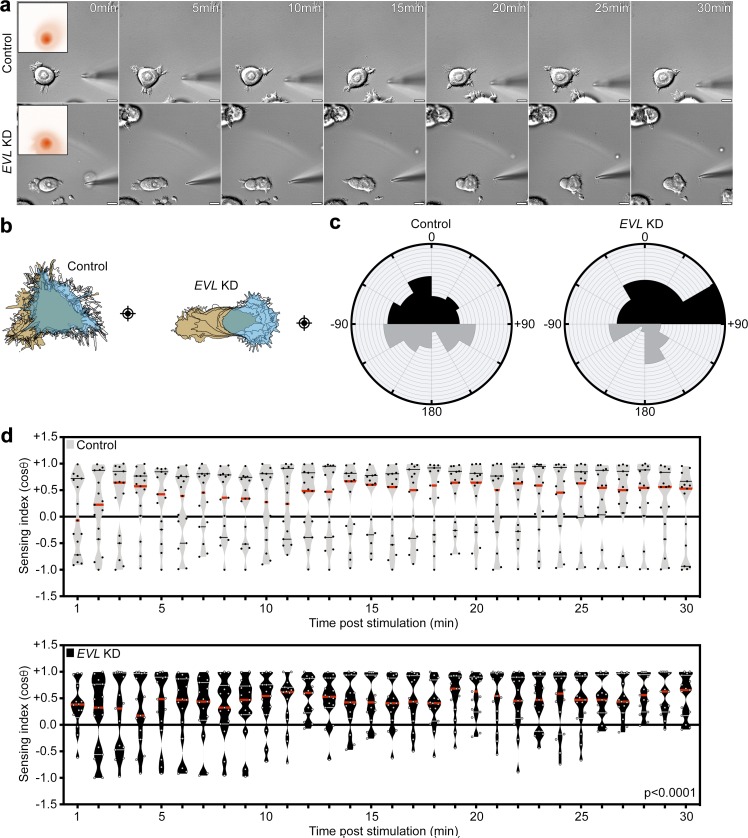
Figure 9.
EVL suppresses chemotactic sensing. (a–d) Control (LKO vector) and EVL KD MCF7 cells were stimulated with an IGF gradient. (a) Still images from representative time-lapse videos of control and EVL KD cells (Video 10). Scale bars are 10 µm. Boxed insets are images of IGF gradients, provided to cells for 2 min. (b) Corresponding cell traces at 0, 5, 10, 15, 20, 25, and 30 min, with starting positions in tan and final positions in blue. Crosshairs denote micropipette positions. (c) Rose plots show cumulative turning angles for control and EVL KD cells. Black sectors denote turns in the direction of the IGF gradient, and gray sectors denote turns away from the IGF gradient. Data are collected from five independent experiments (n = 15 per condition). (d) Sensing indices of control and EVL KD cells over time. Groups are plotted separately for clarity. Two-way ANOVA shows a significant difference in sensing index between control and EVL KD cells (P < 0.0001). Data are collected from five independent experiments; all data points are shown (n = 15 per condition; violin plot shows median and quartiles of sensing indices).

