Figure 1.
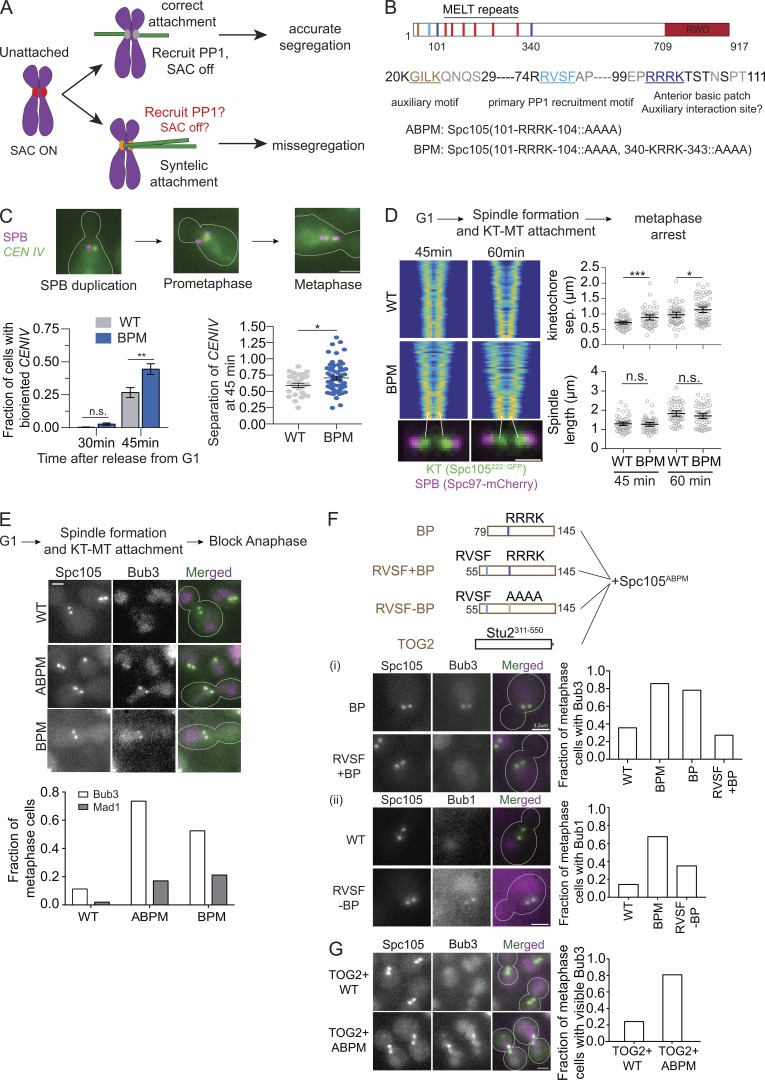
The basic patch near the N-terminus of Spc105 contributes to Glc7 recruitment. (A) Model of how cross-talk between SAC silencing and error correction can interfere with the correction of syntelic attachments and promote chromosome missegregation. (B) Functional domains of Spc105 and the amino acid sequence of its N-terminus. The mutations in Spc105 used in this study are noted at the bottom. (C) Representative micrographs of TetO-TetR-GFP spots. CENIV achieves biorientation faster in cells expressing Spc105BPM compared with WT cells (data presented as mean + SEM; P = ∼0.0041 at 45 min using two-way ANOVA). Sister centromere separation is higher in cells expressing Spc105BPM compared with WT cells, even though the spindle length is not. Scale bar: ∼3.2 µm. The measurements were pooled from three experiments; for WT, n = 273 and 342 at 30 and 45 min, respectively; for BPM, n = 176 and 281 at 30 and 45 min; **, P < 0.01 for the fraction of cells with bioriented CENIV at 45 min; *, P < 0.05 for sister centromere separation at 45 min. (D) Left: V-plots display the normalized distribution of kinetochores along the spindle axis for the indicated strains (n > 50 for each time point). Each row of pixels in the plot represents the symmetrized distribution of Spc105222∷GFP or Spc105BPM,222∷GFP along the spindle axis in one cell. Rows are ranked according to spindle length (see Materials and methods and Marco et al. [2013]). Scale bar: 1.6 µm. Right, top: Average sister kinetochore separation (data presented as mean + SEM; P = 0.0005 [***] and 0.0121 [*] for 45 and 60 min, respectively, using unpaired t test). Right, bottom: Distance between two spindle poles remains unchanged (data presented as mean + SEM; P = 0.6523 and 0.1932 for 45 and 60 min, respectively, using unpaired t test, from two experiments). (E) Top: Workflow. Middle: Representative micrographs of yeast cells expressing the indicated proteins. Scale bar: ∼3.2 µm. Bottom: Frequency of metaphase cells with visible Bub3 and Mad1 at the kinetochores (pooled from two experiments; for Bub3-mCherry, n = 204, 196, and 179, respectively; for Mad1-mCherry, n = 101, 94, and 123). In this and subsequent assays yielding two-category (presence or absence of visible recruitment) scoring data for WT and mutant Spc105, we used Fisher’s exact test for the fractions calculated from the total number of observations. P < 0.0001 for Bub3-mCherry and P < 0.0003 for Mad1-mCherry recruitment. (F) Fusion of an extra basic patch with or without RVSF and their effect on Bub3-Bub1 localization in metaphase cells. Top: Schematics of the fragments fused to the N-terminus of Spc105ABPM. (F, i) Left: Representative micrographs. Scale bar: ∼3.2 µm. Right: Bar graph shows the fraction of cells with visible Bub3-mCherry recruitment (n = 90, 70, 96, and 114, respectively, pooled from two experiments; P < 0.0001 using Fisher’s exact test). (F, ii) Left: Representative micrographs of cells expressing the indicated proteins. Scale bar: ∼3.2 µm. Right: Bar graph shows the fraction of cells with visible Bub1-mCherry recruitment (n = 42, 120, and 103, respectively, pooled from two experiments; P < 0.0152 using Fisher’s exact test). (G) The effect of TOG2-Spc105 fusions on Bub3-mCherry recruitment to bioriented kinetochores. Left: Representative micrographs. Scale bar: ∼3.2 µm. Right: Bar graph showing fraction of metaphase cells with visible Bub3-mCherry recruitment (n = 112 and 144 for TOG2-Spc105 and TOG2-Spc105ABPM, respectively, pooled from two experiments). n.s., not significant.

