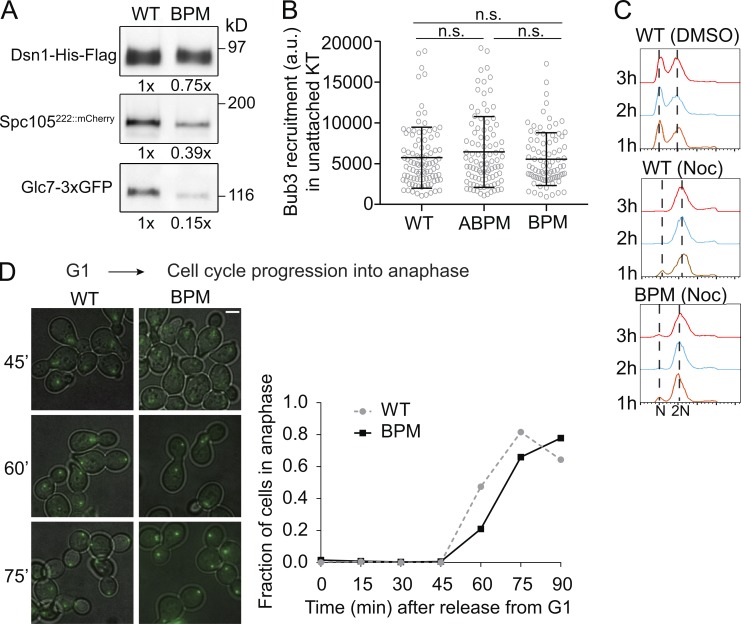
Figure 2.
Spc105BPM does not enhance SAC signaling. (A) Coprecipitation of Glc7-3xGFP with kinetochore particles containing either WT Spc105 or Spc105BPM. Numbers below each lane indicate the band intensity relative to the band intensity for the WT strain. The reduced coprecipitation of Spc105BPM reflects experimental variation and not a reduction in the number of kinetochore-bound molecules (see Fig. S1 B). (B) Bub3-mCherry recruitment by unattached kinetochore clusters in strains expressing the indicated Spc105 variant (mean ± SD; P = 0.2501 obtained from one-way ANOVA, n = 97, 97, and 88, respectively, pooled from two experiments). (C) Flow cytometry of the DNA content from cultures treated with nocodazole (Noc). The 1n and 2n peaks correspond to G1 and G2/M cell populations, respectively (representative histograms from two trials). (D) Left: Representative overlays of transmitted light and fluorescence micrographs of yeast cells at indicated time points after release from G1 arrest. The chart shows the fraction of cells entering anaphase at the indicated time after release from G1 arrest (data pooled from two experiments). It should be noted that the drop in the fraction of anaphase cells in the WT culture at the last time point is because many cells entered the next cell cycle. Scale bar: ∼2.0 µm. Total number of cells analyzed at each time point: WT, n = 206, 182, 385, 276, 274, 250, and 129 at 0, 15, 30, 45, 60, 75, and 90 min, respectively; BPM, n = 331, 353, 286, 306, 414, 408, and 260 at 0, 15, 30, 45, 60, 75, and 90 min, respectively. n.s., not significant.

