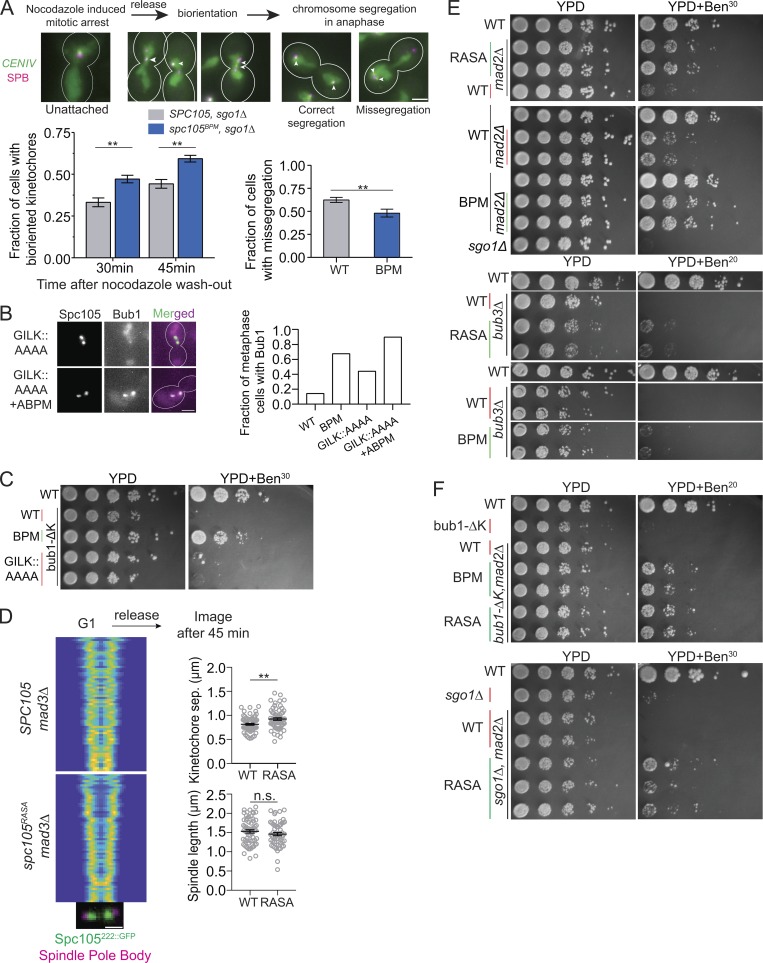
Figure 4.
Glc7 recruited by the RVSF motif in Spc105 is not required for chromosome biorientation. (A) Top: Workflow used to study chromosome biorientation. Arrowheads show the positions of CENIV foci within the spindle axis in each cell. Scale bar: ∼3.2 µm. Bottom, left: Fraction of cells with bioriented CENIV at the indicated time after nocodazole washout (data presented as mean + SEM; two-way ANOVA revealed P = 0.0066 at 30 min, P = 0.0043 at 45 min; for Spc105WT, n = 434 and 464 at 30 and 45 min, respectively; for Spc105BPM, n = 458 and 411 at 30 and 45 min, accumulated from three repeats). Bottom, right: Fraction of anaphase cells with chromosome IV missegregation quantified 45 min after wash (data presented as mean + SEM; *, P = 0.0079 according to unpaired t test). (B) The fraction of metaphase cells with detectable Bub1-mCherry recruitment to bioriented kinetochores in cells expressing the indicated Spc105 variant (P < 0.0015 for all mutant-WT comparisons using Fisher’s exact test. n = 42, 120, 133, and 87 cells for WT, BPM, GILK::AAAA, and GILK::AAAA+ABPM, respectively, accumulated from two repeats). Scale bar: ∼3.2 µm. (C) Spotting assay of the indicated strains on benomyl-containing medium. (D) Separation between sister kinetochore clusters in the indicated strains and at the indicated time after release from a G1 arrest (analysis performed as in Fig. 1 C, >48 cells displayed). Scale bar: 1.6 µm. Right, top: Separation between two sister kinetochores in metaphase (data presented as mean + SEM; *, P = 0.0014, unpaired t test). Right, bottom: Distance between two sister spindle pole bodies in metaphase (data presented as mean + SEM; P = 0.2285, obtained from unpaired t test). (E and F) Spotting assay of the indicated strains on benomyl-containing medium. n.s., not significant.

