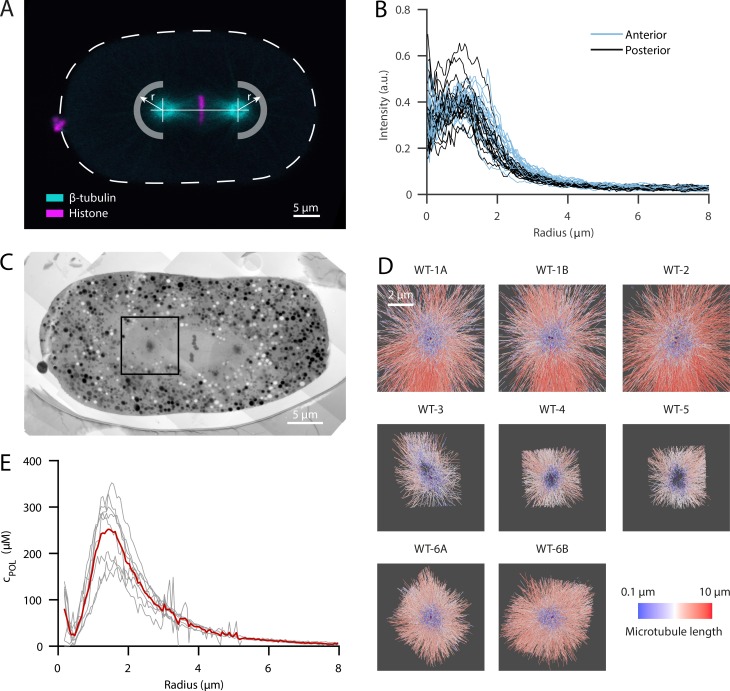
Figure 1.
LM reveals a local enrichment of tubulin at the outer shell of the centrosome which colocalizes with a high density of microtubules recorded by electron tomography. (A) Confocal live-cell imaging of metaphase spindles in one-cell C. elegans embryos labeled with β-tubulin::GFP (cyan) and histone::mCherry (magenta). For the analysis, the centrosome centers were localized manually and fluorescent intensities of β-tubulin::GFP were extracted in radial distances as indicated by arrows for half planes away from the spindle and toward the cell cortex. The anterior side is orientated to the left. Scale bar, 5 µm. (B) Radial profiles of β-tubulin::GFP after subtraction of autofluorescence outside the cell (n = 19). There is no significant difference between anterior (light blue) and posterior centrosomes (dark blue). (C) Overview of a high-pressure frozen and serial-sectioned one-cell embryo in metaphase. Scale bar, 5 µm. The black box indicates a representative area used for electron tomography. (D) Overview of all segmented centrosome models (n = 8). Six different embryos were used. A/B represent centrosomes of the same embryo. Microtubules are color coded by length in a logarithmical scale from short (blue) to long (red) and centrioles (purple). (E) The segmented microtubules of the individual centrosome regions (gray lines, n = 8) are analyzed in radial profiles as shown in A with respect to the local density as length per volume and are converted into the concentration of polymerized tubulin (cPOL). The orange curve represents the local mean value. For registration purposes, the center of the mother centriole is used to align the radial profiles.

