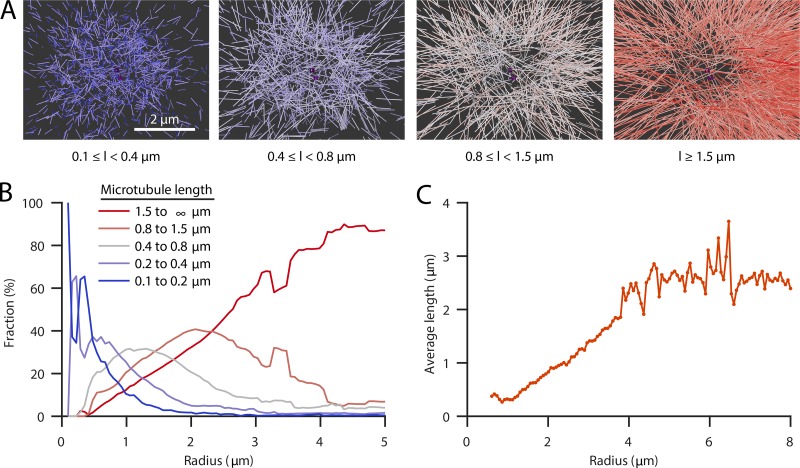
Figure 4.
Localization of short microtubules at the centrosome. (A) Spatial graphs of a representative centrosome (WT-1A) showing groups of microtubules filtered by length (l) from short (0.1–0.4 µm, blue) to long (>1.5 µm, red) and centrioles (purple). Very short microtubules cover predominantly the core of centrosomes, and longer microtubules are found on the outer edge. Scale bar, 2 µm. (B) Plot of the fraction of microtubules of different length groups (short, blue, to long, red) at specific radii from the centrosome center. Short microtubules are predominantly found at the centrosome, whereas longer microtubules tend to be located outside the centrosome. The radial coordinate is corrected for shrinkage, based on the pooled dataset of all individual centrosome regions (n = 8; see Materials and methods). (C) Average microtubule length as a function of the radial position of the pole-proximal microtubule end from the centrosome (based on the pooled dataset of all individual centrosome regions [n = 8]).

