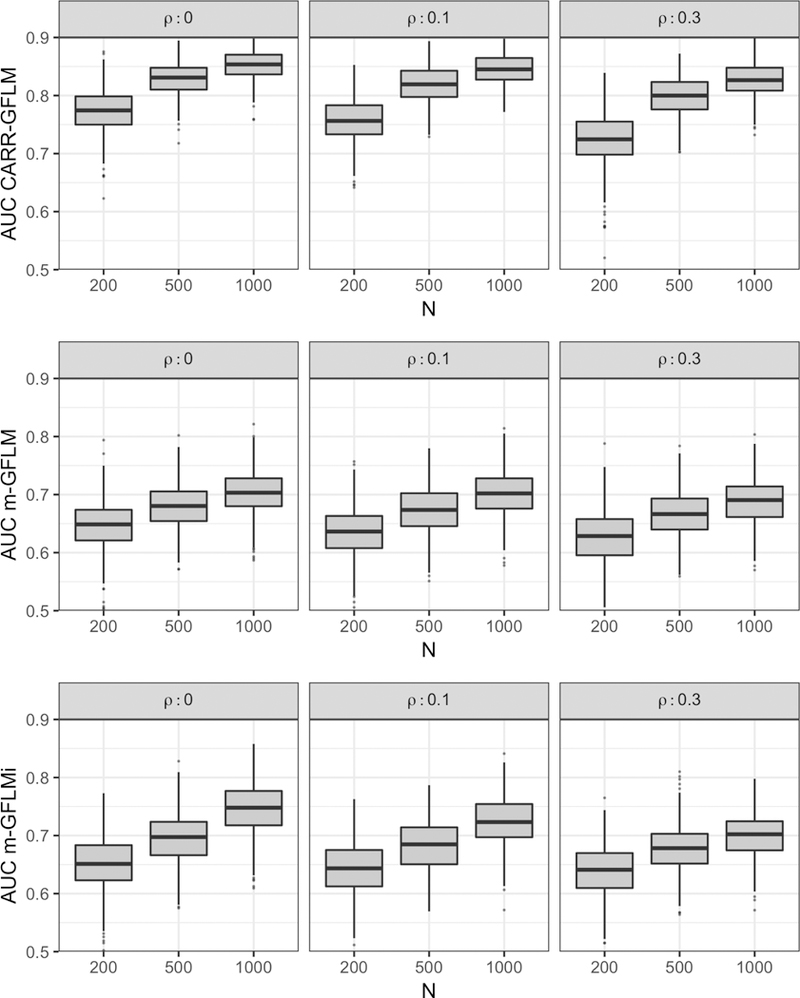
FIGURE 7.

The AUC for the validation data sets from 500 Monte Carlo runs under each simulation setting (ρ = 0,0.1,0.3 in columns and n = 200,500,1000 in columns within panels) for the CARR-GFLM (top row), mGFLM (middle row), and m-GFLMi (bottom row).
